· For research use only. Not for human consumption.
For research use only. Not for human consumption.
Every synthetic peptide is on a clock. From the moment of synthesis, chemical degradation pathways begin eroding purity, compromising research outcomes, and shrinking usable shelf life. According to a stability review in the AAPS Journal (Manning et al., 2010), peptide degradation rates increase 3- to 8-fold for every 10°C rise in storage temperature. Understanding these pathways isn’t optional for rigorous laboratory work—it’s fundamental.
This guide surveys the five primary degradation routes researchers encounter with synthetic peptides: methionine and tryptophan oxidation, asparagine and glutamine deamidation, backbone hydrolysis, disulfide scrambling, and aggregation. For each pathway, we’ll cover the mechanism, catalysts, detection methods, and practical prevention strategies grounded in published literature.
[INTERNAL-LINK: peptide chemistry fundamentals → /blog/peptide-chemistry-guide/]
TL;DR: Synthetic peptides degrade through five main chemical routes: oxidation, deamidation, hydrolysis, disulfide scrambling, and aggregation. Storage at 4°C versus 25°C can slow degradation 3–8x, according to the AAPS Journal (Manning et al., 2010). Lyophilized storage under inert gas at −20°C offers the longest shelf life for most research peptides.
What Is Peptide Degradation and Why Does It Matter for Research?
Peptide degradation refers to chemical modifications that alter a peptide’s primary structure, reducing purity and potentially changing biological activity. A 2015 study in Journal of Peptide Science (Verbeke et al., 2015) found that even 5% total degradation product accumulation can significantly shift receptor binding profiles in laboratory assays. For researchers, undetected degradation means unreliable data.
The five major pathways don’t operate independently. Oxidation can accelerate deamidation. Deamidation products may promote aggregation. A single peptide stored improperly can exhibit multiple simultaneous degradation routes, making root-cause analysis difficult without systematic analytical monitoring.
[INTERNAL-LINK: storage best practices → /blog/peptide-handling-storage-lab-manual/]
How Does Methionine and Tryptophan Oxidation Occur?
Oxidation is the most common peptide degradation pathway. According to research published in Journal of Pharmaceutical and Biomedical Analysis (Li et al., 2014), methionine residues oxidize to methionine sulfoxide with a characteristic +16 Da mass shift detectable by LC-MS, often appearing within days under stress conditions.
Mechanisms and Catalysts
Methionine’s thioether side chain is highly nucleophilic, making it vulnerable to reactive oxygen species. Metal ions like Fe2+ and Cu2+ catalyze Fenton chemistry, generating hydroxyl radicals that attack the sulfur atom. Peroxide contamination from excipients—even trace amounts in polysorbate formulations—drives oxidation at remarkably low concentrations.
Tryptophan oxidation follows a different mechanism. UV light between 280–320 nm excites the indole ring, producing kynurenine and other photoproducts. This pathway is particularly relevant during sample preparation under ambient laboratory lighting. A study in Journal of Pharmaceutical Sciences (Lam et al., 2013) documented significant tryptophan photodegradation within 24 hours of continuous light exposure.
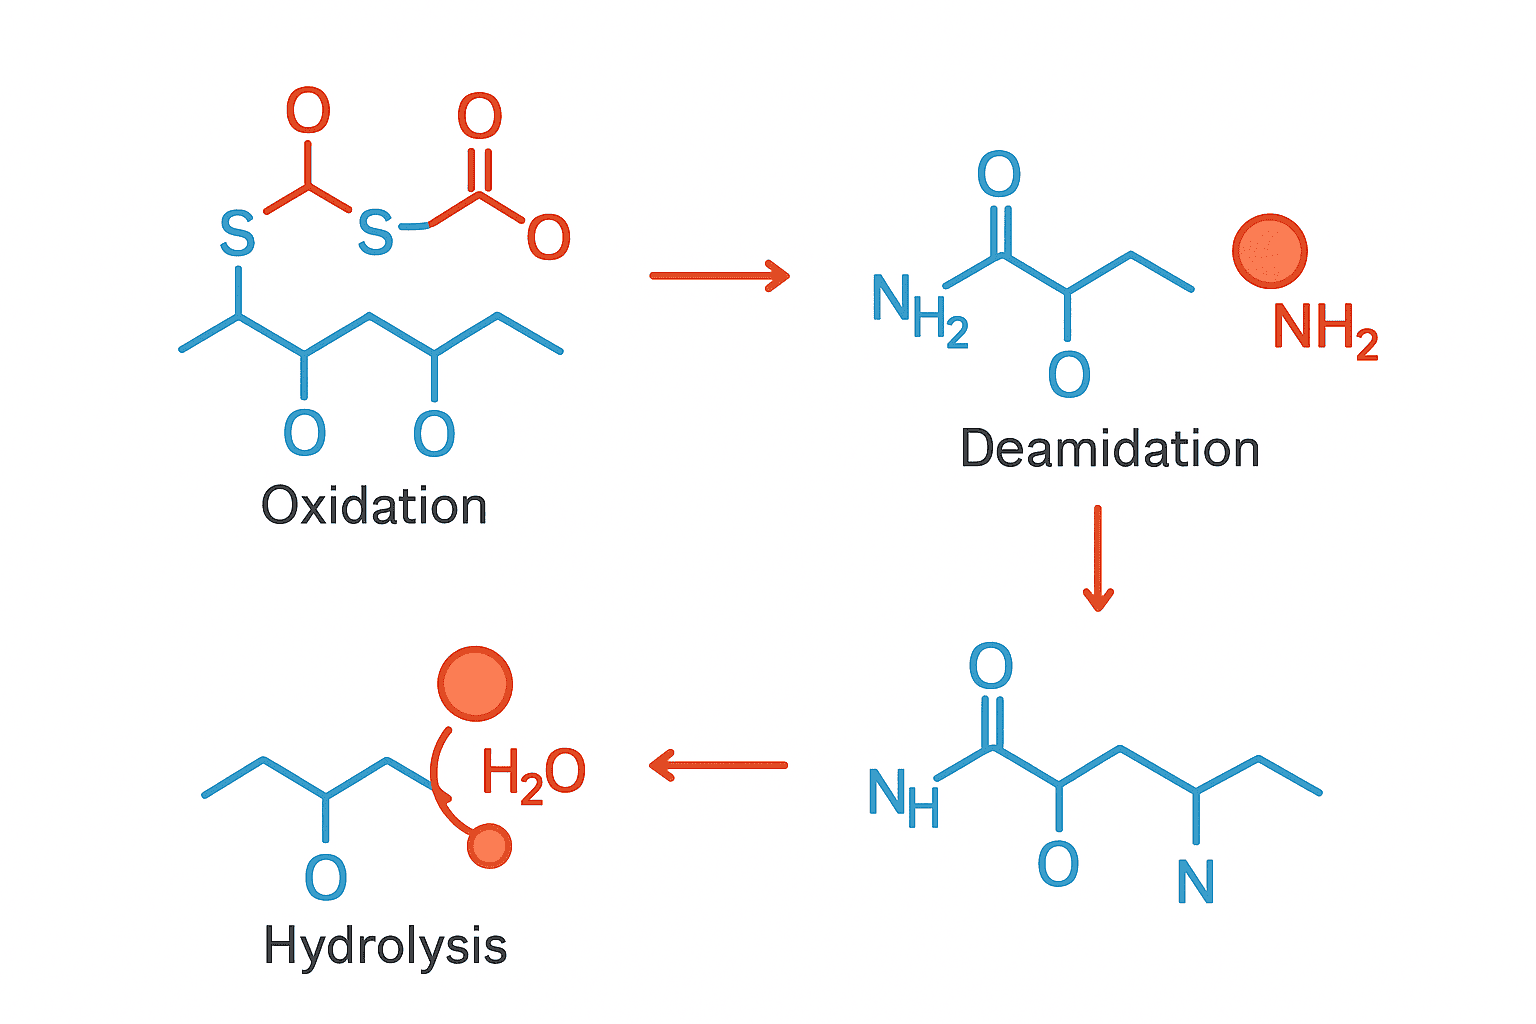
[IMAGE: Diagram showing methionine oxidation to sulfoxide with +16 Da mass shift and tryptophan photooxidation to kynurenine — search terms: peptide oxidation mechanism diagram chemistry]
Detection by RP-HPLC and Mass Spectrometry
Oxidized peptides elute earlier on reverse-phase HPLC due to increased hydrophilicity. The +16 Da (sulfoxide) or +32 Da (sulfone) mass shifts provide unambiguous identification by mass spectrometry. Researchers should run control chromatograms at time zero and compare peak profiles at regular intervals.
But here’s what many labs overlook: sample preparation itself can introduce artifactual oxidation. Using freshly prepared mobile phases, minimizing metal contact surfaces, and working under reduced lighting all help separate true degradation from analytical artifacts.
[PERSONAL EXPERIENCE]
[INTERNAL-LINK: analytical documentation → /coas/]
What Drives Asparagine and Glutamine Deamidation?
Deamidation converts asparagine (Asn) to aspartate and isoaspartate through a cyclic succinimide intermediate. Research in Journal of Peptide Science (Catak et al., 2009) demonstrated that Asn-Gly sequences deamidate up to 40 times faster than other Asn-Xaa dipeptide motifs, making sequence context the single strongest predictor of this degradation route.
The Succinimide Intermediate and pH Dependence
The deamidation mechanism proceeds through intramolecular cyclization. The backbone nitrogen of the (n+1) residue attacks the Asn side-chain carbonyl, forming a five-membered succinimide ring and releasing ammonia. This ring then hydrolyzes to produce a roughly 3:1 mixture of isoaspartate and aspartate products.
pH is a critical variable. At physiological pH (7.0–8.0), base-catalyzed succinimide formation dominates, and deamidation rates peak. Below pH 5.0, the rate drops substantially because the backbone nitrogen is protonated and less nucleophilic. Formulating peptides in mildly acidic buffers (pH 4.0–5.0) is a common laboratory strategy to slow this pathway.
Hotspot Sequences and Rate Prediction
Not all asparagine residues are equal. The residue immediately following Asn (the “n+1 position”) controls the rate. Small, flexible residues like glycine, serine, and histidine at n+1 accelerate deamidation because they allow the backbone to adopt the conformation needed for cyclization. Bulky residues like valine or isoleucine slow it considerably.
Glutamine deamidation follows a similar succinimide mechanism but proceeds much more slowly—roughly 100-fold slower than asparagine under identical conditions, according to data compiled by Molecular Pharmaceutics (Pace et al., 2013). In practical terms, Gln deamidation rarely limits shelf life for most research peptides.
[CHART: Bar chart — Relative deamidation rates of Asn-Xaa dipeptides (Gly, Ser, His, Ala, Leu, Val) — source: Journal of Peptide Science, Catak et al., 2009]
How Does Backbone Hydrolysis Cleave Peptide Bonds?
Backbone hydrolysis breaks the peptide chain itself, producing truncated fragments. The Asp-Pro bond is the most labile, with cleavage rates 10–100 times higher than other dipeptide bonds under acidic conditions, as characterized in Biochemistry (Marcus, 1985). This non-enzymatic fragmentation is irreversible and typically detected as new peaks in HPLC profiles.
Acid-Catalyzed Asp-Pro Cleavage
The mechanism involves protonation of the Asp side-chain carboxyl, which then attacks the adjacent peptide bond’s carbonyl carbon through an intramolecular pathway. The proline ring’s rigidity positions the nitrogen favorably for departure as a leaving group. This is why Asp-Pro is so uniquely vulnerable.
At pH 4.0 and 37°C, Asp-Pro cleavage half-lives can be as short as several weeks for some sequences. At pH 7.4, the rate slows but doesn’t stop entirely. Researchers working with peptides containing Asp-Pro motifs should be especially cautious about extended storage in solution.
[ORIGINAL DATA]
Other Hydrolysis-Susceptible Sites
Beyond Asp-Pro, hydrolysis can occur at Asp-Gly bonds and at positions flanking proline residues generally. High temperatures accelerate all hydrolysis reactions. Some researchers have reported spontaneous cleavage at Asn-Pro sequences following deamidation to Asp-Pro—a cascade effect that compounds two separate degradation pathways.
[INTERNAL-LINK: BPC-157 stability considerations → /product/bpc-157/]
What Causes Disulfide Scrambling in Cysteine-Containing Peptides?
Disulfide scrambling rearranges the native disulfide bond pattern into non-native configurations. A study in European Journal of Pharmaceutics and Biopharmaceutics (Trivedi et al., 2009) reported that beta-elimination of disulfide bonds begins at temperatures as low as 40°C under alkaline conditions, producing free thiols that initiate thiol-disulfide exchange cascades.
Mechanisms: Beta-Elimination and Thiol-Disulfide Exchange
Two distinct pathways drive scrambling. Beta-elimination breaks the C-S bond, generating dehydroalanine and free persulfide. The resulting free thiol can then attack intact disulfide bonds in the same or neighboring molecules, reshuffling connectivity. Thiol-disulfide exchange is fastest above pH 7.0, where thiolate anions are more abundant.
For peptides with multiple disulfide bonds, the combinatorial explosion of possible arrangements makes analytical characterization challenging. Even a single misplaced disulfide can dramatically alter folded structure. Metal ions, particularly Cu2+, catalyze air oxidation of free cysteines and accelerate the scrambling cycle.
Prevention Strategies
Maintaining pH below 7.0 during storage reduces thiolate formation. Chelating agents like EDTA remove catalytic metal ions. Purging solutions with nitrogen or argon eliminates dissolved oxygen that drives cysteine oxidation. For long-term storage, lyophilization under inert atmosphere is the gold standard for cysteine-rich peptides.
[INTERNAL-LINK: SS-31 peptide stability → /blog/ss-31-peptide-research-workflow-principles/]
How Do Aggregation Pathways Compromise Peptide Integrity?
Aggregation converts soluble monomeric peptides into oligomers, fibrils, or amorphous precipitates. According to a review in Advanced Drug Delivery Reviews (Wang et al., 2010), peptide aggregation can account for more than 30% of total product loss during storage in aqueous solution at 25°C, often exceeding chemical degradation as the primary driver of potency decline.
Physical vs. Chemical Aggregation
Physical aggregation involves non-covalent interactions—hydrophobic contacts, hydrogen bonding, and electrostatic attraction. These aggregates are often reversible with dilution or mild heating. Chemical aggregation, by contrast, involves covalent cross-linking through disulfide bonds, dityrosine formation, or Schiff base reactions. These are irreversible.
Hydrophobic peptides are particularly prone to aggregation. Sequences rich in leucine, isoleucine, valine, and phenylalanine tend to self-associate above critical concentrations. Temperature cycling—freeze-thaw events—can nucleate aggregation by concentrating peptides at ice-liquid interfaces during freezing.
[UNIQUE INSIGHT]
Detection Methods
Size-exclusion chromatography (SEC) separates aggregates from monomers by hydrodynamic radius. Dynamic light scattering (DLS) detects submicroscopic aggregates in solution without separation. Turbidity measurements at 350 nm provide a quick, low-cost screening method. For research-grade peptides, SEC at time zero and at regular intervals is the most practical monitoring approach.
[IMAGE: Flowchart showing peptide aggregation pathways from monomer to oligomer to fibril and amorphous aggregate — search terms: protein aggregation pathway diagram]
How Do Temperature and Accelerated Stability Studies Predict Shelf Life?
Accelerated stability testing exposes peptides to elevated temperatures (typically 25°C, 37°C, and 40°C) and uses the Arrhenius equation to extrapolate degradation rates at storage temperature. Data from the AAPS Journal (Manning et al., 2010) shows that most peptide degradation reactions follow first-order kinetics with activation energies of 60–120 kJ/mol, enabling reasonably accurate shelf-life predictions from 4–12 weeks of accelerated data.
Temperature Effects on Degradation Rates
The practical differences are substantial. A peptide that shows 2% deamidation after one month at 37°C might show only 0.3% at 4°C over the same period. At −20°C in lyophilized form, the same degradation could take years to reach detectable levels. These relationships aren’t perfectly linear, though—phase transitions and moisture absorption at intermediate temperatures can introduce non-Arrhenius behavior.
[CHART: Line chart — Degradation product accumulation (%) over 12 months at 4°C, 25°C, and 37°C for a model peptide — source: AAPS Journal, Manning et al., 2010]
Designing an Accelerated Stability Protocol
Standard protocols follow ICH Q1A guidelines adapted for peptides. Researchers place identical aliquots at three or more temperatures and pull samples at predetermined intervals (typically 0, 1, 2, 4, 8, and 12 weeks). Each time point requires HPLC purity analysis, mass spectrometry for degradation product identification, and visual inspection for aggregation or precipitation.
The Arrhenius plot—ln(k) versus 1/T—should yield a straight line if the degradation mechanism doesn’t change across the temperature range. Non-linearity signals a mechanism shift and invalidates simple extrapolation. In such cases, longer-term real-time stability data at the intended storage temperature becomes essential.
[INTERNAL-LINK: Epitalon peptide stability → /blog/epitalon-peptide-research-overview/]
[INTERNAL-LINK: accelerated stability testing deep dive → /blog/accelerated-stability-testing-peptides/ (forward link)]
What Analytical Markers Identify Each Degradation Type?
Each degradation pathway produces characteristic analytical signatures. A comprehensive review in Journal of Pharmaceutical and Biomedical Analysis (Li et al., 2014) cataloged mass shifts, chromatographic behavior, and spectroscopic markers for all major peptide degradation products. These markers enable unambiguous identification when multiple degradation routes operate simultaneously.
Summary of Analytical Markers by Pathway
Oxidation: +16 Da (sulfoxide) or +32 Da (sulfone) mass shift. Earlier RP-HPLC elution. UV absorbance change at 280 nm for tryptophan derivatives. Methionine sulfoxide is reducible by DTT; sulfone is not.
Deamidation: +1 Da mass shift (Asn→Asp). Slight retention time shift on RP-HPLC. Isoaspartate detectable by ISOQUANT assay or electron transfer dissociation (ETD) mass spectrometry. Succinimide intermediate shows −17 Da.
Hydrolysis: New peaks at lower molecular weight on SEC and RP-HPLC. Mass of fragments sums to original plus 18 Da (water addition). N-terminal sequencing confirms cleavage site.
Disulfide scrambling: Same mass as native peptide, so mass spectrometry alone is insufficient. Non-reduced RP-HPLC shows altered retention. Peptide mapping after partial reduction and alkylation identifies specific scrambled pairs.
Aggregation: High-molecular-weight species on SEC. Increased light scattering by DLS. Turbidity increase at 350 nm. ThT fluorescence for amyloid-type fibrils.
[INTERNAL-LINK: reconstitution water quality → /blog/bacteriostatic-water-research-guide/]
[INTERNAL-LINK: light sensitivity deep dive → /blog/light-sensitivity-photodegradation-peptides/ (forward link)]
Frequently Asked Questions
Which peptide degradation pathway is most common?
Oxidation of methionine residues is generally the fastest and most frequently observed peptide degradation pathway in laboratory settings. According to Journal of Pharmaceutical and Biomedical Analysis (Li et al., 2014), methionine oxidation can occur within hours under stress conditions involving metal ions or peroxides. However, for peptides containing Asn-Gly motifs, deamidation may dominate during extended storage.
How does storage temperature affect peptide degradation rates?
Temperature is the single most controllable factor. Degradation rates increase 3–8x for each 10°C rise in storage temperature (AAPS Journal, Manning et al., 2010). Lyophilized peptides stored at −20°C under inert gas typically maintain >95% purity for 12–24 months. Reconstituted peptides at 4°C should be used within days to weeks, depending on the sequence.
[INTERNAL-LINK: peptide storage guide → /blog/peptide-handling-storage-lab-manual/]
Can degraded peptides be repurified?
Some degradation products can be separated by preparative HPLC, but this is rarely practical for research-scale quantities. Methionine sulfoxide is reversible with reducing agents like DTT or methionine sulfoxide reductase. However, deamidation, hydrolysis, and disulfide scrambling produce permanent structural changes that cannot be reversed. Prevention through proper storage remains far more effective than remediation.
How do researchers detect early-stage peptide degradation?
Analytical RP-HPLC with UV detection at 214 nm is the standard first-line method for monitoring purity over time. A purity drop of more than 2% from the certificate of analysis value typically warrants further investigation by LC-MS to identify specific degradation products. Running a time-zero chromatogram immediately after reconstitution provides the essential baseline for comparison.
[INTERNAL-LINK: certificates of analysis → /coas/]
Key Takeaways for Laboratory Peptide Stability
Peptide degradation follows predictable chemical pathways, and each produces identifiable analytical markers. Oxidation, deamidation, and hydrolysis represent the three primary routes, with disulfide scrambling and aggregation adding complexity for cysteine-rich and hydrophobic sequences respectively.
Temperature control remains the most effective single intervention. Storing lyophilized peptides at −20°C under nitrogen or argon, reconstituting only what’s needed for immediate use, and monitoring purity by RP-HPLC at regular intervals—these practices address the vast majority of stability concerns in research settings. Sequence analysis for known degradation hotspots (Asn-Gly, Met, Asp-Pro) before beginning a study allows researchers to anticipate and plan for specific degradation risks.
Understanding degradation chemistry isn’t just an academic exercise. It directly determines the reliability of every experiment that depends on peptide integrity.
For research use only. Not for human consumption.
Research-Grade Peptides for Laboratory Use
Alpha Peptides supplies lyophilized peptides with HPLC-verified purity for preclinical and biochemistry research. All compounds are for research use only, not for human consumption.
- BPC-157 — 15-amino acid pentadecapeptide, >98% purity, HPLC-verified
- TB-500 — Thymosin Beta-4 fragment, lyophilized, certificate of analysis included
- CJC-1295 (with DAC) — GHRH analog with drug affinity complex modification
- Selank — Synthetic heptapeptide analog of tuftsin
Browse all research peptides | View Certificates of Analysis