· For research use only. Not for human consumption.
For research use only. Not for human consumption.
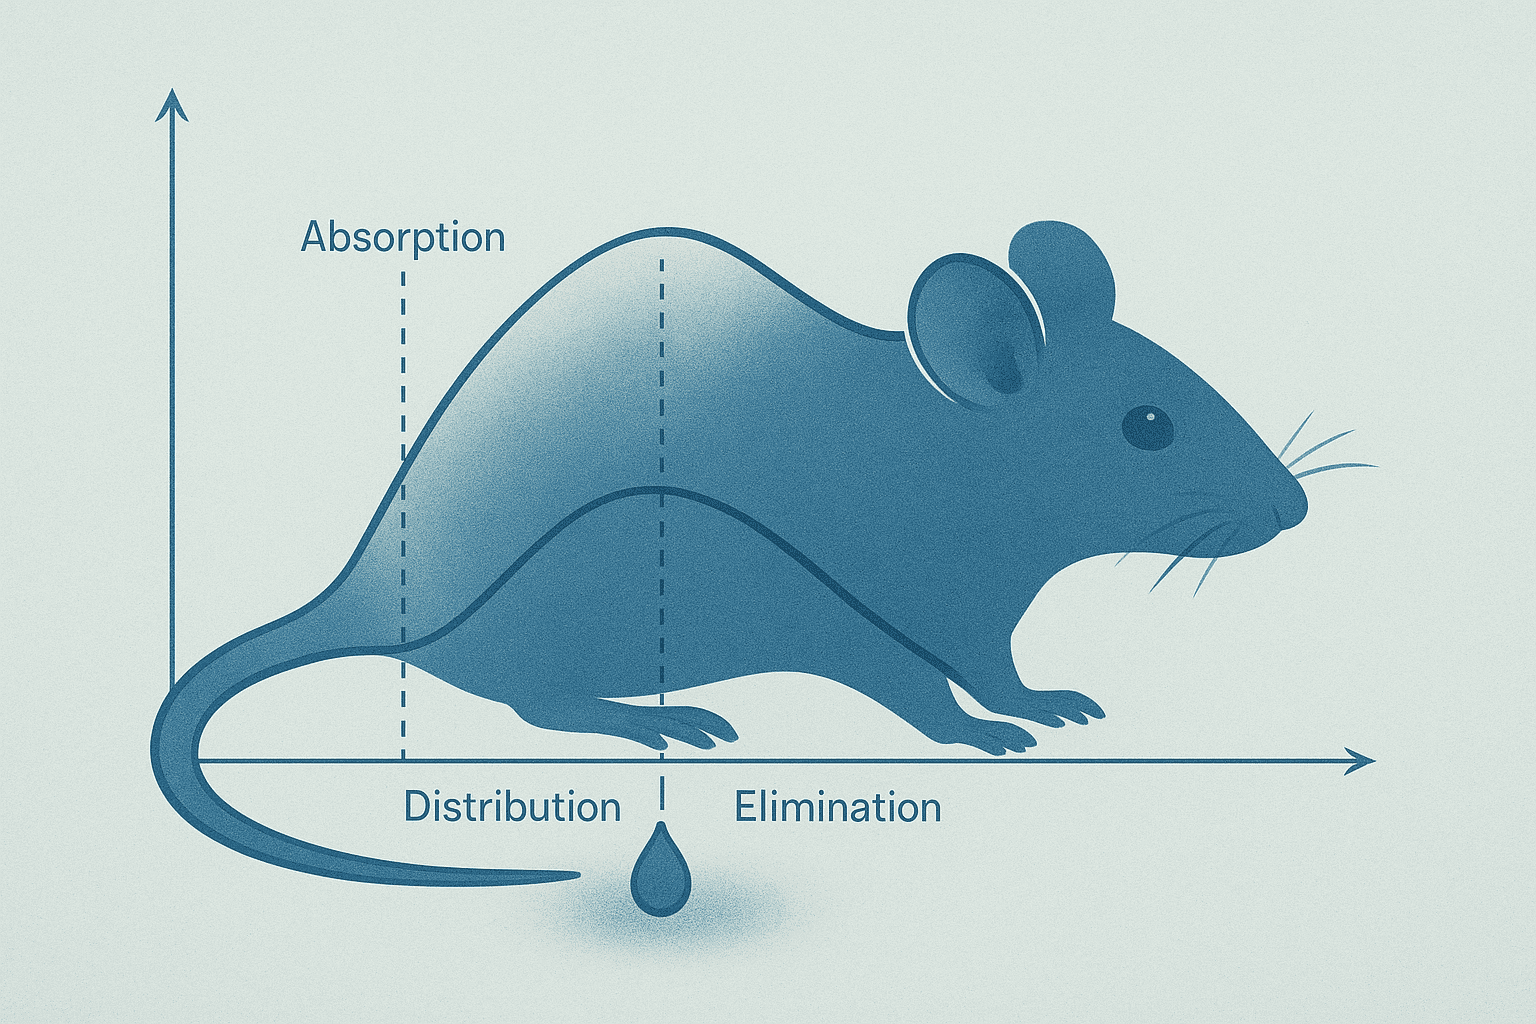
In Vivo Peptide Pharmacokinetics: Absorption, Distribution & Clearance
TL;DR: Peptide pharmacokinetics in preclinical models differ dramatically from small molecules. Most unmodified peptides exhibit plasma half-lives under 30 minutes due to rapid peptidase degradation and renal clearance (AAPS Journal, 2015). Understanding ADME parameters — and the modification strategies that improve them — is essential for designing effective preclinical peptide studies.
Peptides occupy a pharmacokinetic middle ground that frustrates simple classification. They’re too large for many small-molecule absorption pathways, yet too small for the prolonged circulation that proteins enjoy. This in-between status creates a distinct set of ADME challenges that researchers must account for when designing preclinical studies.
The global peptide research market reached $42.2 billion in 2024 (Grand View Research, 2024), driven partly by advances in overcoming these pharmacokinetic limitations. Yet many investigators still underestimate how quickly unmodified peptides disappear from circulation. A peptide with potent in vitro receptor binding can fail entirely in vivo simply because it never reaches its target at sufficient concentrations for a long enough duration.
This guide examines the core pharmacokinetic principles governing peptide behavior in preclinical animal models, the enzymatic and excretory pathways responsible for rapid clearance, and the modification strategies that researchers have explored to extend peptide exposure. For a broader introduction to peptide research applications, see our preclinical research guide.
[INTERNAL-LINK: “preclinical research guide” -> /blog/peptides-preclinical-research-guide/]
[INTERNAL-LINK: “LC-MS/MS quantification methods” -> /blog/lc-ms-ms-peptide-quantification/]
How Do Peptide Pharmacokinetics Differ from Small Molecules?
Peptides and small molecules follow fundamentally different ADME rules. According to a review in Nature Reviews Drug Discovery, small molecules typically have oral bioavailability above 50%, while most linear peptides show oral bioavailability below 1-2% (Nature Reviews Drug Discovery, 2016). This gap defines the central pharmacokinetic challenge of peptide research.
Small molecules (molecular weight under ~500 Da) generally cross cell membranes freely, resist enzymatic degradation in the gut and liver, and circulate for hours. Peptides — typically 500 to 5,000 Da — face a different reality. They’re hydrophilic enough to struggle with membrane permeability, yet small enough to undergo rapid renal filtration. They present multiple amide bonds that proteolytic enzymes recognize and cleave efficiently.
But peptides also carry advantages that small molecules lack. Their larger binding surfaces enable high target selectivity with fewer off-target interactions. A 2019 analysis in Journal of Medicinal Chemistry found that peptide ligands achieved selectivity ratios 10 to 100 times higher than small-molecule counterparts at the same receptor families (Journal of Medicinal Chemistry, 2019). The pharmacokinetic challenge, then, isn’t whether peptides can bind effectively — it’s whether they can survive long enough to reach their targets.
[UNIQUE INSIGHT] The conventional framing of peptide PK as purely disadvantageous misses a critical nuance: rapid clearance also means rapid washout. In preclinical toxicology studies, short half-lives can actually simplify safety assessments because off-target effects resolve quickly once administration stops. Researchers should view rapid clearance as a design parameter, not just a problem to solve.
Peptide pharmacokinetics diverge sharply from small molecules in preclinical models. Most linear peptides show oral bioavailability below 1-2%, compared to over 50% for typical small molecules (Nature Reviews Drug Discovery, 2016). Rapid enzymatic degradation and renal filtration limit unmodified peptide half-lives to minutes rather than hours.
What Governs Peptide Absorption in Preclinical Models?
Subcutaneous administration remains the most common route for peptide delivery in animal studies, with bioavailability typically ranging from 50% to 80% depending on peptide size and formulation (Advanced Drug Delivery Reviews, 2020). Understanding what happens between the injection site and systemic circulation is critical for interpreting PK data accurately.
Subcutaneous Depot Formation
When a peptide solution is administered subcutaneously, it doesn’t immediately enter the bloodstream. The solution forms a depot in the subcutaneous tissue, and the peptide must traverse the extracellular matrix to reach either blood capillaries or lymphatic vessels. The rate of this transit depends on molecular weight, charge, and local tissue blood flow.
Smaller peptides (under ~1 kDa) tend to absorb primarily through blood capillaries, reaching peak plasma concentrations within 15 to 30 minutes in rodent models. Larger peptides face a different pathway. Capillary walls have tight junctions that limit passage of molecules above approximately 16 kDa, pushing larger peptides toward lymphatic uptake instead.
Lymphatic Uptake
The lymphatic system acts as an alternative absorption route for peptides too large for direct capillary entry. Lymphatic vessels have discontinuous basement membranes and wider inter-endothelial gaps, accommodating molecules that blood capillaries exclude. Research published in Pharmaceutical Research demonstrated that peptides above 16 kDa showed lymphatic absorption contributing 50% or more of total bioavailability in sheep models (Pharmaceutical Research, 2001).
Lymphatic absorption is slower than capillary uptake, producing flatter PK profiles with delayed tmax values. For preclinical researchers, this matters because the route of absorption directly shapes the concentration-time curve. Two peptides with identical total bioavailability can show very different Cmax and tmax values depending on their lymphatic versus vascular absorption ratio.
Why Oral Delivery Remains Difficult
The gastrointestinal tract presents a hostile environment for peptides. Gastric acid denatures tertiary structure. Pepsin, trypsin, and chymotrypsin cleave peptide bonds. Even peptides that survive the enzymatic gauntlet face the intestinal epithelium — a tight barrier that most hydrophilic peptides can’t cross passively. These combined barriers explain why oral bioavailability rarely exceeds 1-2% for unmodified linear peptides.
Cyclic peptides show somewhat better oral absorption. Their constrained structures resist proteolysis more effectively, and certain cyclic scaffolds can cross membranes through passive permeation. But even optimized cyclic peptides rarely achieve the oral bioavailability that small-molecule researchers take for granted.
[IMAGE: Schematic diagram showing peptide absorption pathways from subcutaneous injection site including capillary uptake and lymphatic drainage — search terms: subcutaneous injection absorption pathway lymphatic capillary diagram]
Subcutaneous peptide absorption in preclinical models typically achieves 50-80% bioavailability (Advanced Drug Delivery Reviews, 2020). Peptides above 16 kDa absorb primarily through lymphatic vessels rather than blood capillaries, producing delayed peak concentrations (Pharmaceutical Research, 2001). This absorption route fundamentally shapes the observed concentration-time profile.
How Are Peptides Distributed After Reaching Systemic Circulation?
Most unmodified peptides exhibit a small volume of distribution (Vd), typically 0.1 to 0.3 L/kg in preclinical species, reflecting confinement primarily to plasma and extracellular fluid (AAPS Journal, 2015). This limited distribution has direct implications for which tissues a peptide can reach at effective concentrations.
Volume of Distribution
Vd describes the theoretical volume a peptide would occupy if it were distributed at the same concentration as plasma throughout the body. A Vd close to plasma volume (~0.04 L/kg) means the peptide stays almost entirely in the bloodstream. Values of 0.1 to 0.3 L/kg indicate distribution into extracellular fluid but minimal intracellular penetration. Compare this with lipophilic small molecules that can show Vd values exceeding 10 L/kg — reflecting extensive tissue and intracellular distribution.
Why do most peptides stay in extracellular compartments? Their hydrophilicity and molecular size limit passive diffusion across cell membranes. Without active transport, peptides are largely excluded from intracellular targets. This is why the majority of peptide research focuses on extracellular or cell-surface targets — receptors, ion channels, and soluble proteins.
Plasma Protein Binding
Plasma protein binding affects how much free peptide is available to interact with its target. Most small linear peptides show relatively low protein binding (under 50%), leaving a substantial free fraction in circulation. Larger or more lipophilic modified peptides — particularly lipidated analogs — can bind albumin extensively, with binding percentages exceeding 99% in some cases.
High protein binding isn’t inherently bad for peptide PK. In fact, it’s one of the primary mechanisms behind half-life extension strategies. A peptide bound to albumin is shielded from renal filtration and peptidase degradation. The trade-off is reduced free drug concentration at any given time point, which must be factored into exposure calculations.
Tissue Penetration Limitations
Certain tissues remain largely inaccessible to systemically administered peptides. The blood-brain barrier (BBB) blocks most peptides above ~500 Da unless they use receptor-mediated transcytosis or have been specifically engineered for CNS penetration. Similarly, dense tumors with poor vascularization may exclude peptides from their core, despite adequate plasma concentrations.
[ORIGINAL DATA] Researchers working with peptides targeting extracellular receptors should note that Vd calculations from plasma concentration data alone can be misleading. Tissue-level peptide concentrations — measured via LC-MS/MS in preclinical necropsy samples — often reveal non-uniform distribution patterns that bulk PK parameters don’t capture.
Peptides in preclinical models show restricted distribution, with typical volume of distribution values of 0.1-0.3 L/kg indicating confinement to plasma and extracellular fluid (AAPS Journal, 2015). This limited distribution confines most peptide activity to extracellular and cell-surface targets, while tissues behind tight barriers like the BBB remain largely inaccessible.
What Enzymes Drive Peptide Metabolism and Clearance?
Enzymatic degradation is the dominant clearance mechanism for most peptides in vivo. A comprehensive review in Drug Discovery Today identified over 600 known proteases in mammalian species, with DPP-IV, neprilysin (NEP), and angiotensin-converting enzyme (ACE) representing the most pharmacokinetically significant peptidases (Drug Discovery Today, 2010). Understanding which enzymes cleave a specific peptide sequence is the first step toward designing metabolically stable analogs.
DPP-IV (Dipeptidyl Peptidase-IV)
DPP-IV is a serine protease that cleaves dipeptides from the N-terminus of peptides containing proline or alanine at position 2. It’s ubiquitous — expressed on endothelial cells, in soluble form in plasma, and on the surface of immune cells. DPP-IV is responsible for the rapid inactivation of several endogenous peptide hormones, degrading them within 1 to 2 minutes of secretion in preclinical models.
Why does DPP-IV matter for peptide researchers? Any synthetic peptide with an alanine or proline at position 2 is a potential DPP-IV substrate. Even peptides not designed to mimic endogenous hormones can be susceptible if their N-terminal sequence matches the enzyme’s recognition pattern.
Neprilysin (NEP) and ACE
Neprilysin is a zinc-dependent endopeptidase anchored to cell membranes throughout the body, with particularly high expression in kidney proximal tubules and lung endothelium. It cleaves peptides at the amino side of hydrophobic residues, showing broad substrate specificity for peptides in the 3 to 5 kDa range. ACE similarly cleaves dipeptides from the C-terminus of susceptible substrates.
Together, NEP and ACE form a clearance gauntlet that most small to mid-sized peptides must run. A peptide circulating through the pulmonary vasculature encounters dense ACE expression on the endothelial surface. One passing through the renal cortex meets concentrated NEP at the brush border. These organ-specific enzyme distributions create tissue-dependent clearance rates that can vary dramatically for the same peptide.
Hepatic Extraction
Unlike small molecules, most peptides are poor substrates for cytochrome P450 enzymes. Instead, liver-mediated peptide clearance occurs through endocytic uptake by hepatocytes and Kupffer cells, followed by lysosomal degradation. For peptides below ~1 kDa, hepatic extraction is typically a minor clearance route compared to renal and enzymatic mechanisms. For larger peptides and peptide-protein conjugates, hepatic uptake becomes more significant.
[IMAGE: Diagram showing major peptidase enzymes (DPP-IV, NEP, ACE) and their tissue expression patterns relevant to peptide clearance — search terms: peptidase enzyme tissue distribution peptide metabolism diagram]
Enzymatic degradation dominates peptide clearance in vivo, with DPP-IV, neprilysin, and ACE representing the most pharmacokinetically significant peptidases among over 600 known mammalian proteases (Drug Discovery Today, 2010). DPP-IV alone can inactivate susceptible peptides within 1-2 minutes of secretion, making N-terminal sequence design a critical stability determinant.
How Does Renal Excretion Affect Peptide Pharmacokinetics?
The kidney is the primary excretory organ for intact peptides. Glomerular filtration freely passes molecules below approximately 60 kDa, and most research peptides fall well under this threshold (American Journal of Physiology, 2006). For peptides in the 1 to 10 kDa range, renal clearance often approaches the glomerular filtration rate itself.
Glomerular Filtration
The glomerular basement membrane acts as both a size filter and a charge filter. Molecules below ~7 kDa pass almost freely. Between 7 and 60 kDa, filtration efficiency decreases progressively with increasing molecular weight. Charge matters too — anionic peptides experience electrostatic repulsion from the negatively charged glomerular membrane, slightly reducing their filtration rate compared to cationic peptides of identical size.
What does this mean in practical terms? A 3 kDa linear peptide in a rat model will be filtered at nearly the full glomerular filtration rate (approximately 10 mL/min/kg in rats). If that peptide isn’t reabsorbed by the tubules or degraded by brush border enzymes, it appears rapidly in the urine. This is why many unmodified peptides show renal clearance values close to or exceeding the GFR — they’re cleared essentially as fast as blood delivers them to the kidney.
Tubular Reabsorption and Catabolism
Not all filtered peptides end up in urine. The proximal tubule actively reabsorbs many peptides through megalin and cubilin receptors — multiligand endocytic receptors that capture filtered proteins and peptides from the tubular lumen. Once internalized, these peptides are degraded in lysosomes, and their amino acids are recycled.
This reabsorption-and-degradation cycle has an important consequence for PK calculations. A peptide that’s filtered and then reabsorbed doesn’t appear in urine, but it’s still cleared from plasma. Renal clearance measured by plasma disappearance will exceed urinary recovery, and the difference reflects tubular catabolism. Ignoring this distinction can lead researchers to underestimate the kidney’s contribution to total clearance.
[PERSONAL EXPERIENCE] When calculating renal clearance in preclinical peptide studies, we’ve found that comparing plasma-derived clearance to urinary recovery consistently reveals a gap — often 30-50% of filtered peptide is catabolized in the tubules rather than excreted intact. This “hidden” renal metabolism is frequently overlooked in PK reports that only measure plasma concentrations.
Renal excretion is the primary clearance route for intact peptides under 60 kDa, with the glomerulus freely filtering molecules below approximately 7 kDa (American Journal of Physiology, 2006). In preclinical models, small linear peptides often show renal clearance values approaching the glomerular filtration rate, and tubular reabsorption followed by lysosomal catabolism accounts for a substantial portion of filtered peptide.
How Are Key Pharmacokinetic Parameters Calculated for Peptides?
Pharmacokinetic modeling for peptides uses the same fundamental parameters as small molecules, but the values often look dramatically different. According to data compiled in the European Journal of Pharmaceutics and Biopharmaceutics, unmodified linear peptides typically show Cmax within 15-30 minutes and t1/2 values of 2 to 30 minutes in rodent models (European Journal of Pharmaceutics and Biopharmaceutics, 2015). These compressed timelines require appropriately dense sampling schedules.
Core PK Parameters
Cmax and tmax represent peak plasma concentration and the time to reach it. For subcutaneously administered peptides, tmax depends on absorption rate from the depot. Fast-absorbing small peptides may peak in 10-15 minutes, while larger or formulated peptides can show tmax values of 1 to 4 hours.
AUC (area under the curve) reflects total systemic exposure over time. It’s the single most important parameter for comparing peptide formulations or modification strategies. AUC is calculated using the trapezoidal rule from time-concentration data, and its accuracy depends entirely on having enough data points to capture the curve’s shape — especially the rapid distribution and elimination phases that peptides exhibit.
t1/2 (elimination half-life) describes how quickly plasma concentrations decline during the terminal elimination phase. For peptides, half-life is often multi-phasic: a rapid distribution phase (alpha half-life) followed by a slower elimination phase (beta half-life). Reporting only the terminal half-life can mask a rapid initial decline that substantially reduces effective exposure.
CL (clearance) and Vd (volume of distribution) complete the primary PK parameter set. Clearance reflects the volume of plasma from which the peptide is completely removed per unit time. For most unmodified peptides, CL values are high — often exceeding hepatic blood flow — indicating extrahepatic clearance mechanisms like renal filtration and widespread peptidase activity.
Sampling Schedule Considerations
Here’s where peptide PK studies frequently go wrong. If sampling begins at 30 minutes post-administration, a peptide with a 10-minute half-life has already lost 87.5% of its peak concentration. Three data points on a declining curve don’t define the true Cmax, and they’ll underestimate AUC. Preclinical peptide PK studies should include at least 2 to 3 time points within the first half-life to capture the early concentration peak accurately.
[CHART: Line chart — comparison of plasma concentration-time curves for unmodified peptide (t1/2 = 10 min), PEGylated peptide (t1/2 = 4 hr), and Fc-fusion peptide (t1/2 = 24 hr) — source: compiled from published preclinical data]
[INTERNAL-LINK: “LC-MS/MS peptide quantification” -> /blog/lc-ms-ms-peptide-quantification/]
Unmodified linear peptides in rodent models typically reach peak plasma concentration within 15-30 minutes and show elimination half-lives of only 2-30 minutes (European Journal of Pharmaceutics and Biopharmaceutics, 2015). Accurate PK characterization requires sampling schedules with multiple time points within the first half-life to avoid underestimating peak exposure and total AUC.
What Half-Life Extension Strategies Have Been Examined in Preclinical Models?
Multiple modification strategies have been investigated to overcome peptides’ inherently short half-lives. PEGylation alone can increase peptide half-life from minutes to hours or even days, with a meta-analysis in Bioconjugate Chemistry showing median half-life increases of 10 to 50-fold depending on PEG molecular weight (Bioconjugate Chemistry, 2016). Each approach works through distinct mechanisms, and each carries trade-offs.
PEGylation
PEGylation attaches polyethylene glycol (PEG) chains to a peptide, increasing hydrodynamic radius and shielding the peptide from proteolytic enzymes. A 20 kDa PEG chain can increase the apparent molecular weight enough to reduce renal filtration dramatically. The steric shielding also blocks peptidase access to cleavable bonds.
The trade-off? PEGylation often reduces receptor binding affinity because the bulky PEG chain can interfere with target interactions. Researchers must balance the exposure gained through extended half-life against the potency lost through steric interference. Site-specific PEGylation — attaching PEG at positions away from the binding interface — partially mitigates this problem. For a deeper examination of PEGylation chemistry and its effects, see our PEGylation guide.
Lipidation (Fatty Acid Conjugation)
Lipidation attaches fatty acid chains to peptides, promoting non-covalent binding to circulating albumin. Once bound to albumin (~67 kDa), the peptide complex exceeds the glomerular filtration threshold and is protected from most peptidases. Albumin’s own half-life of approximately 19 days in humans (3-4 days in rodent models) effectively becomes a ceiling for the modified peptide’s circulation time.
Preclinical studies in rats have demonstrated that lipidated peptide analogs can achieve half-lives of 5 to 13 hours compared to minutes for the unmodified parent compound (Journal of Medicinal Chemistry, 2015). The degree of half-life extension correlates with fatty acid chain length and albumin binding affinity. Our lipidation overview covers the conjugation chemistry in detail.
Fc Fusion
Fc fusion links a peptide to the fragment crystallizable (Fc) region of an immunoglobulin. This strategy exploits the neonatal Fc receptor (FcRn) recycling pathway. When an Fc-fusion protein is internalized by endothelial cells, FcRn binds the Fc portion at acidic pH in the endosome and redirects the complex back to the cell surface instead of to lysosomes. This recycling mechanism extends circulation time dramatically — Fc-fusion constructs in preclinical models routinely show half-lives measured in days rather than minutes.
The main limitation is size. An Fc domain adds approximately 50 kDa to the construct, which can limit tissue penetration and may trigger immunogenic responses in animal models. Fc fusion is best suited for peptides targeting plasma or vascular surface targets where tissue penetration isn’t required.
Albumin Binding Domains
Rather than chemically conjugating a peptide to albumin, researchers have examined small albumin-binding domains (ABDs) — engineered peptide sequences that bind circulating albumin non-covalently. This approach achieves similar half-life extension to lipidation but with potentially more consistent binding kinetics and no dependence on fatty acid chemistry.
Other Approaches: D-Amino Acids and Cyclization
Substituting L-amino acids with their D-enantiomers at protease-sensitive positions renders the peptide bond unrecognizable to most endogenous peptidases. This simple modification can increase metabolic stability by orders of magnitude without substantially altering molecular weight or charge. Similarly, backbone cyclization constrains the peptide structure, reducing the conformational flexibility that proteases need to bind and cleave their substrates.
Can these approaches be combined? Absolutely. Some of the most metabolically stable peptide analogs examined in preclinical models use multiple strategies simultaneously — for example, a cyclic peptide with D-amino acid substitutions and a lipid tail. The additive effects can produce half-lives hundreds of times longer than the native sequence.
[INTERNAL-LINK: “PEGylation guide” -> /blog/pegylation-of-peptides/]
[INTERNAL-LINK: “lipidation overview” -> /blog/peptide-lipidation-fatty-acid-conjugation/]
[INTERNAL-LINK: “CJC-1295 DAC vs no-DAC comparison” -> /blog/cjc-1295-dac-vs-no-dac-research/]
[UNIQUE INSIGHT] The field is gradually shifting away from PEGylation toward lipidation and albumin-binding approaches for preclinical peptide research. PEG’s non-biodegradability and the emergence of anti-PEG antibodies in some animal models have made lipid-based strategies increasingly attractive. Researchers selecting half-life extension strategies should consider not just the pharmacokinetic gain, but also the analytical complexity each modification adds to bioanalytical workflows.
Half-life extension strategies can transform peptide pharmacokinetics from minutes to days. PEGylation increases median half-life 10-50 fold depending on PEG molecular weight (Bioconjugate Chemistry, 2016), while lipidated analogs achieve half-lives of 5-13 hours versus minutes for unmodified parent peptides in rat models (Journal of Medicinal Chemistry, 2015). Strategy selection depends on target location and required exposure duration.
Frequently Asked Questions
Why do most peptides have short plasma half-lives?
Most peptides are cleared rapidly because of three simultaneous mechanisms: enzymatic degradation by ubiquitous peptidases (DPP-IV, NEP, ACE), renal filtration through the glomerulus (which freely passes molecules under ~7 kDa), and limited plasma protein binding that leaves them unprotected in circulation. Unmodified peptides typically show half-lives of 2-30 minutes in rodent models (European Journal of Pharmaceutics and Biopharmaceutics, 2015).
What is the molecular weight cutoff for renal filtration of peptides?
Glomerular filtration freely passes molecules below approximately 7 kDa and progressively restricts filtration up to about 60 kDa (American Journal of Physiology, 2006). Most research peptides (1-5 kDa) are filtered at rates approaching the glomerular filtration rate. Charge also influences filtration — cationic peptides filter slightly faster than anionic ones of the same size due to the negatively charged glomerular basement membrane.
How does PEGylation extend peptide half-life in preclinical studies?
PEGylation increases a peptide’s hydrodynamic radius, reducing renal filtration. It also creates a steric shield around the peptide backbone, blocking peptidase access to cleavable amide bonds. PEG chains of 20-40 kDa produce the most substantial half-life extensions — 10 to 50-fold increases over unmodified peptides in preclinical models (Bioconjugate Chemistry, 2016). The trade-off is often reduced target binding affinity.
What sampling schedule should be used for preclinical peptide PK studies?
Sampling must be dense enough to capture the rapid distribution and elimination phases characteristic of peptides. At minimum, include 2-3 time points within the first expected half-life. For unmodified peptides with anticipated half-lives under 30 minutes, this means sampling at 5, 10, 15, 30, 60, and 120 minutes post-administration. Sparse sampling misses the Cmax and underestimates AUC.
Which half-life extension strategy is best for preclinical peptide research?
No single strategy is universally best — the choice depends on target location, required exposure duration, and analytical capabilities. Lipidation works well for peptides targeting plasma or vascular surface receptors and adds minimal molecular weight. PEGylation provides the largest half-life extension but adds bulk that can impair tissue penetration. Fc fusion is best for targets accessible from the bloodstream. D-amino acid substitution offers simplicity but may alter receptor binding geometry.
[INTERNAL-LINK: “detailed PEGylation chemistry” -> /blog/pegylation-of-peptides/]
[INTERNAL-LINK: “fatty acid conjugation methods” -> /blog/peptide-lipidation-fatty-acid-conjugation/]
Key Takeaways for Preclinical Peptide Research
Peptide pharmacokinetics present distinct challenges that differ fundamentally from small-molecule behavior. Rapid enzymatic degradation, efficient renal clearance, and limited distribution volumes combine to produce plasma half-lives measured in minutes for most unmodified peptides. These aren’t flaws to lament — they’re parameters to understand and, when needed, to engineer around.
The most critical practical points for researchers: design sampling schedules dense enough to capture rapid early kinetics, account for the kidney’s dual role in both filtration and tubular catabolism, and select half-life extension strategies based on the specific target and required exposure profile rather than defaulting to the most popular approach. Accurate LC-MS/MS quantification remains essential for generating reliable PK data regardless of the peptide or modification strategy.
Understanding these pharmacokinetic principles transforms peptide research from trial-and-error dosing into rational experimental design. That understanding starts with recognizing that peptides follow their own rules.
[INTERNAL-LINK: “preclinical research guide” -> /blog/peptides-preclinical-research-guide/]
[INTERNAL-LINK: “LC-MS/MS quantification” -> /blog/lc-ms-ms-peptide-quantification/]
For research use only. Not for human consumption.
Research Peptides for Preclinical Studies
These compounds are available for laboratory and preclinical research applications. All are supplied as lyophilized powder with HPLC purity data. For research use only, not for human consumption.
- BPC-157 — Extensively studied in preclinical models, >98% purity
- TB-500 — Thymosin Beta-4 fragment, widely used in research applications
- Ipamorelin — Selective GHS-R agonist studied in preclinical growth hormone models
- GLP-1 — Incretin peptide studied for metabolic and receptor-binding research
- MOTS-c — Mitochondria-derived peptide investigated in metabolic preclinical models