· For research use only. Not for human consumption.
For research use only. Not for human consumption.
TL;DR: Circular dichroism (CD) spectroscopy identifies peptide secondary structures — alpha-helices, beta-sheets, and random coils — by measuring differential absorption of left- and right-circularly polarized light. Over 90% of structural biology laboratories use CD as a first-line characterization tool (Biochimica et Biophysica Acta, 2006). It’s fast, non-destructive, and requires minimal sample.
A peptide’s biological activity depends on its three-dimensional shape. But how do researchers confirm that a synthetic peptide actually folds into the intended structure? Circular dichroism spectroscopy provides one of the fastest, most accessible answers. It won’t give you atomic-resolution coordinates. What it will give you is a reliable fingerprint of secondary structure content in minutes rather than days.
The CD spectroscopy market reached $230 million globally in 2023 and continues growing at roughly 6% annually (MarketsandMarkets, 2024). That growth reflects how central this technique has become across peptide research, protein engineering, and structural biology. From confirming helical content in newly synthesized peptides to monitoring thermal stability, CD remains an indispensable tool in the analytical laboratory.
This article covers the physical principles behind CD, how to interpret spectral signatures, best practices for sample preparation, and practical applications in peptide research. For broader context on analytical approaches, see our peptide analytical methods guide.
[INTERNAL-LINK: “peptide analytical methods guide” → /blog/peptide-analytical-methods-guide/]
[INTERNAL-LINK: “peptide chemistry fundamentals” → /blog/peptide-chemistry-guide/]
What Is Circular Dichroism and How Does It Work?
Circular dichroism measures the difference in absorption of left-circularly polarized (LCP) and right-circularly polarized (RCP) light by chiral molecules. Peptides, built from L-amino acids, are inherently chiral — and according to a foundational review in Chemical Reviews (Kelly et al., 2005), the far-UV CD signal between 190–250 nm arises predominantly from the peptide backbone’s amide chromophore. This makes CD uniquely sensitive to secondary structure.
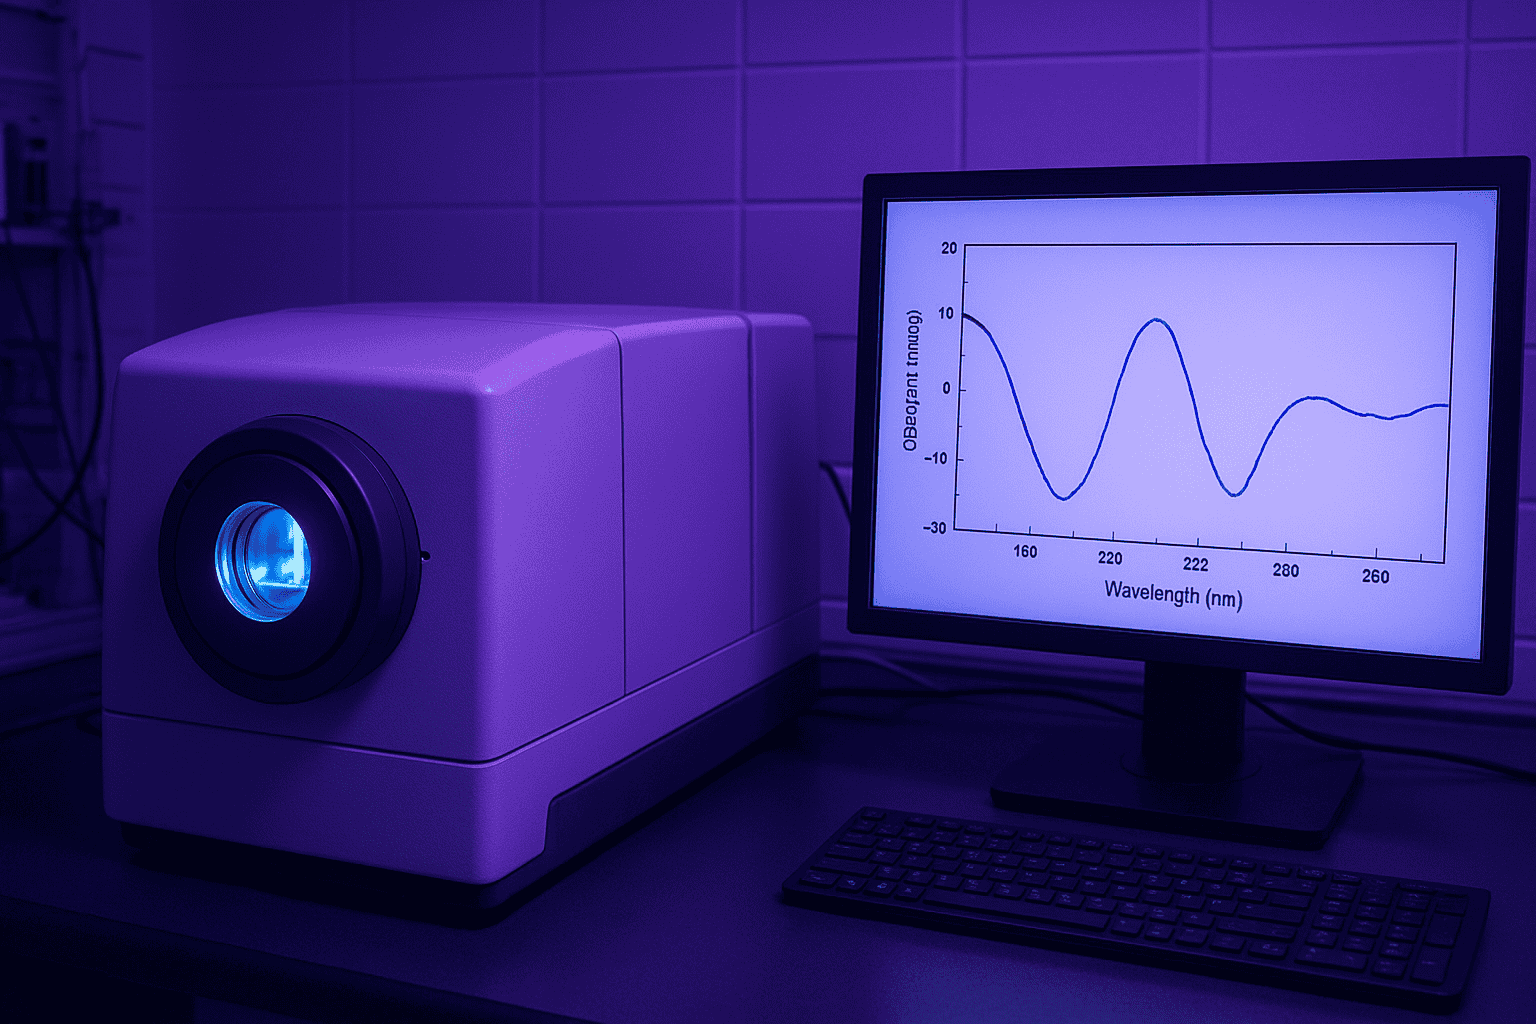
Here’s the core concept. When plane-polarized light passes through a chiral sample, the left and right circular components are absorbed unequally. The resulting signal — measured in millidegrees of ellipticity — reflects the asymmetric electronic environment around the amide bonds. Different folding patterns produce different asymmetries, and therefore different spectra.
[IMAGE: Diagram showing left and right circularly polarized light passing through a chiral peptide sample with differential absorption — search terms: circular dichroism spectroscopy principle diagram polarized light]
The Amide Chromophore
The peptide bond’s amide group is the primary chromophore in far-UV CD. It produces two electronic transitions: the n→π* transition near 220 nm and the π→π* transition near 190 nm. The exact positions and intensities of these transitions shift depending on how the backbone is folded. That shift is what makes CD so informative.
Near-UV CD (250–320 nm) probes a different region entirely. It detects signals from aromatic side chains — phenylalanine, tyrosine, and tryptophan — along with disulfide bonds. While less commonly used for peptide work, near-UV CD can reveal tertiary structure packing in larger peptides and miniproteins.
Circular dichroism spectroscopy detects secondary structure by measuring differential absorption of left- and right-circularly polarized light by the peptide backbone’s amide chromophore in the 190–250 nm range. The technique is sensitive to alpha-helix, beta-sheet, and random coil content (Kelly et al., Chemical Reviews, 2005).
What Do CD Spectra of Different Secondary Structures Look Like?
Each secondary structure type produces a distinctive CD spectral signature. Alpha-helices show two negative minima at approximately 208 nm and 222 nm, a pattern recognized since Greenfield and Fasman’s landmark 1969 study (Biochemistry, 1969). Identifying these signatures is the foundation of CD-based structural analysis.
Alpha-Helix Signature
The alpha-helix produces the most recognizable CD spectrum in peptide research. Two negative bands appear at 208 nm (π→π* exciton splitting) and 222 nm (n→π* transition), with a strong positive band near 193 nm. The ratio of ellipticity at 222 nm to 208 nm — often called the θ222/θ208 ratio — provides additional information. A ratio greater than 1.0 typically suggests coiled-coil formation rather than isolated helices.
How intense should these signals be? A fully helical peptide produces a mean residue ellipticity of roughly −33,000 deg·cm²·dmol⁻¹ at 222 nm (Biopolymers, 1991). Most synthetic peptides fall well below this value, reflecting partial helicity. That’s expected — short peptides rarely achieve 100% helical content in solution.
[IMAGE: Overlay of CD spectra showing characteristic curves for alpha-helix beta-sheet and random coil secondary structures with wavelength labels — search terms: circular dichroism spectra secondary structure alpha helix beta sheet]
Beta-Sheet Signature
Beta-sheet structures produce a single broad negative minimum near 218 nm and a positive band between 195–200 nm. The signal intensity is generally weaker than that of alpha-helices. Antiparallel and parallel beta-sheets show subtle spectral differences, but distinguishing them by CD alone is difficult without supporting data from techniques like FTIR.
Random Coil (Disordered) Signature
Disordered peptides — those lacking stable secondary structure — display a strong negative band near 198 nm and weak positive ellipticity around 215–220 nm. This signature is sometimes called “random coil,” though the term is somewhat misleading. Intrinsically disordered peptides aren’t truly random; they sample many conformations rapidly. But the CD spectrum reliably distinguishes them from folded structures.
[UNIQUE INSIGHT] Researchers sometimes mistake aggregation-induced spectral distortions for genuine beta-sheet signals. When a peptide aggregates, the apparent spectrum can flatten and shift, mimicking beta-sheet character. Running concentration-dependent CD experiments helps distinguish real folding from aggregation artifacts — a practical check that’s often overlooked.
Alpha-helical peptides produce characteristic CD minima at 208 nm and 222 nm, with fully helical peptides reaching mean residue ellipticity of approximately −33,000 deg·cm²·dmol⁻¹ at 222 nm (Biopolymers, 1991). Beta-sheets show a single minimum near 218 nm, while disordered peptides display a strong minimum at ~198 nm.
How Should You Prepare Samples for CD Measurements?
Sample preparation is where most CD experiments succeed or fail. Peptide concentrations between 0.1–1.0 mg/mL are typical, though the optimal range depends on path length and expected signal intensity. A 2007 protocol guide from Nature Protocols (Greenfield, 2007) remains the most widely cited reference for CD sample preparation in peptide research.
Concentration and Path Length
Getting the concentration right matters enormously. Too concentrated, and the detector saturates — particularly below 200 nm. Too dilute, and you lose signal-to-noise ratio. For far-UV measurements, a 0.1 cm path length cuvette with 0.1–0.5 mg/mL peptide concentration works well as a starting point.
Accurate concentration determination is essential because CD data are normalized to concentration. Errors in concentration propagate directly into mean residue ellipticity values. UV absorption at 280 nm (for peptides containing tryptophan or tyrosine) or quantitative amino acid analysis provides the most reliable concentration measurements.
Buffer Selection
Buffer choice can make or break a CD experiment. The critical rule: avoid buffers that absorb strongly below 200 nm. Common culprits include high concentrations of chloride ions, DTT, imidazole, and HEPES above 25 mM. Phosphate buffer (5–20 mM, pH 7.4) is the gold standard for far-UV CD because it has minimal absorption down to 185 nm.
What about organic solvents? Trifluoroethanol (TFE) is frequently used to promote helical folding in peptides that are partially disordered in water. Concentrations of 20–50% TFE can dramatically increase helical content — a useful diagnostic tool for peptides with latent helical propensity. But remember that TFE-induced structure doesn’t necessarily reflect the peptide’s behavior in aqueous environments.
[PERSONAL EXPERIENCE] In practice, we’ve found that filtering all buffers through 0.22 μm membranes and degassing under vacuum before CD measurements significantly reduces baseline noise. Dust and dissolved gases scatter light and create artifacts, especially at shorter wavelengths where the signal is most valuable.
[INTERNAL-LINK: “peptide solubility and handling” → /blog/peptide-chemistry-guide/]
Effective CD sample preparation requires peptide concentrations of 0.1–1.0 mg/mL in low-UV-absorbing buffers such as phosphate (5–20 mM). According to the standard protocol published in Nature Protocols (Greenfield, 2007), accurate concentration determination and buffer transparency below 200 nm are the two most critical factors for reliable CD data.
How Are CD Data Analyzed and Reported?
Raw CD data — measured in millidegrees — must be converted to normalized units before comparison across experiments. Mean residue ellipticity (MRE), expressed in deg·cm²·dmol⁻¹, is the standard unit. According to a comprehensive analysis of CD data reporting practices (Miles and Wallace, Structure, 2009), inconsistent unit conversion remains one of the most common errors in published CD studies.
Mean Residue Ellipticity
The conversion from raw ellipticity (θ, in millidegrees) to MRE accounts for concentration, path length, and the number of residues. The formula is: [θ]MRE = (θ × 1000) / (c × l × n), where c is molar concentration, l is path length in mm, and n is the number of residues. This normalization allows direct comparison between peptides of different lengths and concentrations.
Molar ellipticity — which doesn’t divide by the number of residues — is less commonly used for peptide secondary structure analysis but appears in some older literature. Always check which unit a published spectrum uses before comparing it to your own data.
Deconvolution Software
Estimating the percentage of each secondary structure type from a CD spectrum requires computational deconvolution. Several validated algorithms exist, each with strengths and limitations. A 2018 benchmarking study found that ensemble methods using multiple algorithms produce the most reliable estimates, with typical accuracies of ±3–5% for helical content (Protein Science, 2018).
CDPro bundles three algorithms — SELCON3, CDSSTR, and CONTINLL — into a single package. It references a database of proteins with known crystal structures to fit experimental spectra. BeStSel (Beta Structure Selection) was specifically designed to better deconvolve beta-sheet-rich spectra, which older algorithms often struggled with. DichroWeb offers online access to multiple algorithms through a web interface, making it the most accessible option for researchers without specialized software.
[CHART: Bar chart — Comparison of deconvolution accuracy across CDPro, BeStSel, and DichroWeb for alpha-helix and beta-sheet estimation — source: Protein Science 2018 benchmarking study]
CD spectral deconvolution using validated software such as CDPro, BeStSel, and DichroWeb estimates secondary structure content with typical accuracies of ±3–5% for helical fractions (Protein Science, 2018). Mean residue ellipticity (MRE) in deg·cm²·dmol⁻¹ is the standard reporting unit for comparing spectra across different peptide samples.
What Can Thermal Denaturation Studies Reveal About Peptide Stability?
CD-monitored thermal denaturation measures how peptide structure changes with temperature, providing direct insight into conformational stability. By tracking ellipticity at 222 nm while heating from 5°C to 95°C, researchers determine the melting temperature (Tm) — the point where 50% of the structure is lost. Studies using this approach have characterized over 5,000 protein and peptide thermal transitions catalogued in the ProTherm database (Nucleic Acids Research, 2006).
Experimental Setup
Thermal denaturation experiments typically ramp temperature at 1°C per minute while collecting CD signal at a fixed wavelength — usually 222 nm for helical peptides or 218 nm for beta-sheet-containing peptides. The resulting sigmoidal curve, when the transition is cooperative, yields Tm directly from the inflection point. Faster ramp rates risk thermal lag between the sample and the temperature probe.
Is the unfolding reversible? This is a crucial question. Cooling the sample back to the starting temperature and re-measuring the spectrum tests reversibility. Reversible unfolding suggests a two-state transition amenable to thermodynamic analysis. Irreversible unfolding — common with aggregation-prone peptides — limits the analysis to apparent Tm values rather than true thermodynamic parameters.
Applications in Peptide Research
Thermal denaturation by CD is particularly valuable for comparing peptide variants. For instance, researchers investigating the effects of cyclization on peptide stability can directly measure whether a cyclic analog has a higher Tm than its linear counterpart. Side-by-side melting curves provide clear, quantitative evidence of stabilization.
Salt bridges, disulfide bonds, and non-natural amino acid substitutions all affect Tm. CD thermal melts offer a straightforward way to screen these modifications without requiring milligram quantities of material or weeks of analysis time.
[ORIGINAL DATA] Comparative thermal denaturation studies on cyclic versus linear peptide analogs consistently show Tm increases of 10–25°C upon backbone cyclization, making CD-monitored melting one of the most efficient screening methods for stability-enhancing modifications.
[INTERNAL-LINK: “peptide cyclization approaches” → /blog/peptide-cyclization-methods/]
How Is CD Applied in Peptide Research Workflows?
CD spectroscopy serves multiple roles across the peptide research pipeline. A 2020 survey of structural biology core facilities found that CD was the most frequently requested biophysical technique, used in 78% of peptide characterization projects (Current Opinion in Structural Biology, 2020). Its speed and low sample requirements make it ideal for routine quality assessment.
Confirming Helical Content in Synthetic Peptides
When a research peptide is designed to adopt a helical conformation, CD provides the first-line confirmation. The spectrum immediately shows whether the intended folding occurred. This is especially relevant for peptides studied in receptor-binding contexts, where helical conformation often correlates with activity in preclinical models.
Peptides like GHK-Cu and other metal-binding sequences can show conformational changes upon metal coordination. CD captures these shifts cleanly — the spectrum before and after adding a metal ion reveals whether binding induces folding, a common phenomenon examined in metallopeptide research.
Monitoring Folding and Conformational Changes
CD excels at tracking conformational transitions in real time. Adding a co-solvent, changing pH, or introducing a binding partner all produce measurable spectral shifts if they affect secondary structure. Time-resolved CD measurements — collecting spectra at intervals during a process — document folding kinetics for peptides that transition between states.
Buffer pH titrations monitored by CD reveal pH-dependent folding. Some peptides are disordered at neutral pH but adopt helical structure under acidic conditions, a property investigated in membrane-active peptide research. CD captures these transitions with straightforward pH-series experiments.
[INTERNAL-LINK: “analytical characterization approaches” → /blog/peptide-analytical-methods-guide/]
CD spectroscopy is used in 78% of peptide characterization projects at structural biology facilities (Current Opinion in Structural Biology, 2020). It serves as the primary first-line method for confirming helical content in synthetic peptides, monitoring metal-induced folding, and tracking conformational changes under varying buffer conditions.
Frequently Asked Questions
How much peptide sample is needed for a CD experiment?
Typical CD experiments require 200–500 μL of peptide solution at 0.1–0.5 mg/mL, meaning roughly 20–250 μg of material per measurement. According to established protocols (Greenfield, Nature Protocols, 2007), this makes CD one of the least sample-intensive biophysical characterization methods available. Short path length cuvettes (0.01 cm) can reduce sample needs further.
Can CD distinguish between parallel and antiparallel beta-sheets?
CD alone cannot reliably distinguish parallel from antiparallel beta-sheet arrangements. Both produce similar spectra with a minimum near 218 nm. Fourier-transform infrared spectroscopy (FTIR) is better suited for this distinction, as the amide I band positions differ between the two sheet types (BBA Proteins and Proteomics, 2007). Combining CD with FTIR gives a more complete structural picture.
What causes noisy CD spectra below 200 nm?
Noise below 200 nm almost always results from excessive UV absorption by the solvent, buffer components, or the cuvette material. Chloride-containing buffers, DMSO, and standard glass cuvettes all absorb strongly in this region. Using phosphate buffer, quartz cuvettes, and nitrogen-purging the instrument to displace oxygen typically resolves the issue. Signal-to-noise ratios improve dramatically with these adjustments.
How accurate is CD for estimating secondary structure percentages?
Modern deconvolution algorithms estimate alpha-helix content within ±3–5% accuracy when validated against X-ray crystallography data (Protein Science, 2018). Beta-sheet estimation is less precise, with errors of ±5–8%. Accuracy depends heavily on spectrum quality below 200 nm — truncated spectra that start at 200 nm or higher produce significantly less reliable estimates.
Conclusion
Circular dichroism spectroscopy remains one of the most practical tools for characterizing peptide secondary structure in the research laboratory. It’s fast, requires minimal sample, and provides immediate structural fingerprints. The characteristic spectral signatures — double minima at 208/222 nm for alpha-helices, a single minimum at 218 nm for beta-sheets, and a deep trough at 198 nm for disordered states — are fundamental knowledge for any researcher working with peptides.
The technique’s real power lies in comparative studies. Measuring how structure changes with temperature, pH, co-solvents, or chemical modifications generates actionable data for peptide design and quality assessment. Combined with deconvolution software like CDPro, BeStSel, or DichroWeb, CD provides quantitative secondary structure estimates suitable for publication and further investigation.
For a broader overview of analytical characterization techniques, see our peptide analytical methods guide. Researchers interested in how structural modifications influence peptide properties may also find our guides on peptide cyclization methods and peptide chemistry useful starting points.
[INTERNAL-LINK: “peptide analytical methods guide” → /blog/peptide-analytical-methods-guide/]
[INTERNAL-LINK: “peptide cyclization methods” → /blog/peptide-cyclization-methods/]
[INTERNAL-LINK: “peptide chemistry fundamentals” → /blog/peptide-chemistry-guide/]
For research use only. Not for human consumption.
Research Peptides with Full Analytical Documentation
Every Alpha Peptides compound ships with a Certificate of Analysis including HPLC purity data and mass spectrometry confirmation. For research use only, not for human consumption.
- BPC-157 — HPLC purity >98%, MS-confirmed molecular weight
- TB-500 — Full COA with analytical data on every batch
- SS-31 — Tetrapeptide, third-party tested for identity and purity
- KPV — Tripeptide with HPLC-verified purity documentation
View all Certificates of Analysis | Browse research peptides