· For research use only. Not for human consumption.
For research use only. Not for human consumption.
TL;DR: ESI-MS excels at high-resolution peptide analysis when coupled with liquid chromatography, while MALDI-TOF offers faster throughput and better contaminant tolerance. Together, these two peptide mass spectrometry techniques cover virtually all molecular weight confirmation and sequencing needs in modern peptide research, with ESI-MS dominating LC-MS/MS workflows that account for over 70% of proteomics experiments (Chemical Reviews, 2021).
Every research peptide needs its identity confirmed. Mass spectrometry is how that happens. Whether you’re verifying molecular weight after synthesis or detecting subtle post-translational modifications, mass spectrometry remains the gold standard analytical technique for peptide characterization in laboratory settings.
The global mass spectrometry market reached $6.3 billion in 2023 and is expected to grow at 7.2% CAGR through 2030 (Grand View Research, 2024). Two ionization methods dominate peptide research: electrospray ionization (ESI) and matrix-assisted laser desorption/ionization (MALDI). But which one should a researcher choose? The answer depends on the specific analytical question, sample complexity, and throughput requirements.
This guide compares ESI-MS and MALDI-TOF across every dimension that matters for peptide research — from ionization principles to spectral interpretation. For a broader overview of analytical quality methods, see our peptide analytical methods guide.
[INTERNAL-LINK: “peptide analytical methods guide” → /blog/peptide-analytical-methods-guide/]
[INTERNAL-LINK: “research documentation standards” → /blog/peptide-research-documentation-standards/]
How Does Electrospray Ionization Mass Spectrometry (ESI-MS) Work?
ESI-MS generates multiply charged ions by spraying a peptide solution through a charged capillary at atmospheric pressure. According to a landmark review in Mass Spectrometry Reviews, ESI produces intact gas-phase ions from peptides ranging from 500 Da to over 100 kDa with charge states typically between +2 and +6 for standard peptides (Konermann et al., Mass Spectrometry Reviews, 2013). This multiple-charging phenomenon is what makes ESI uniquely powerful for peptide analysis.
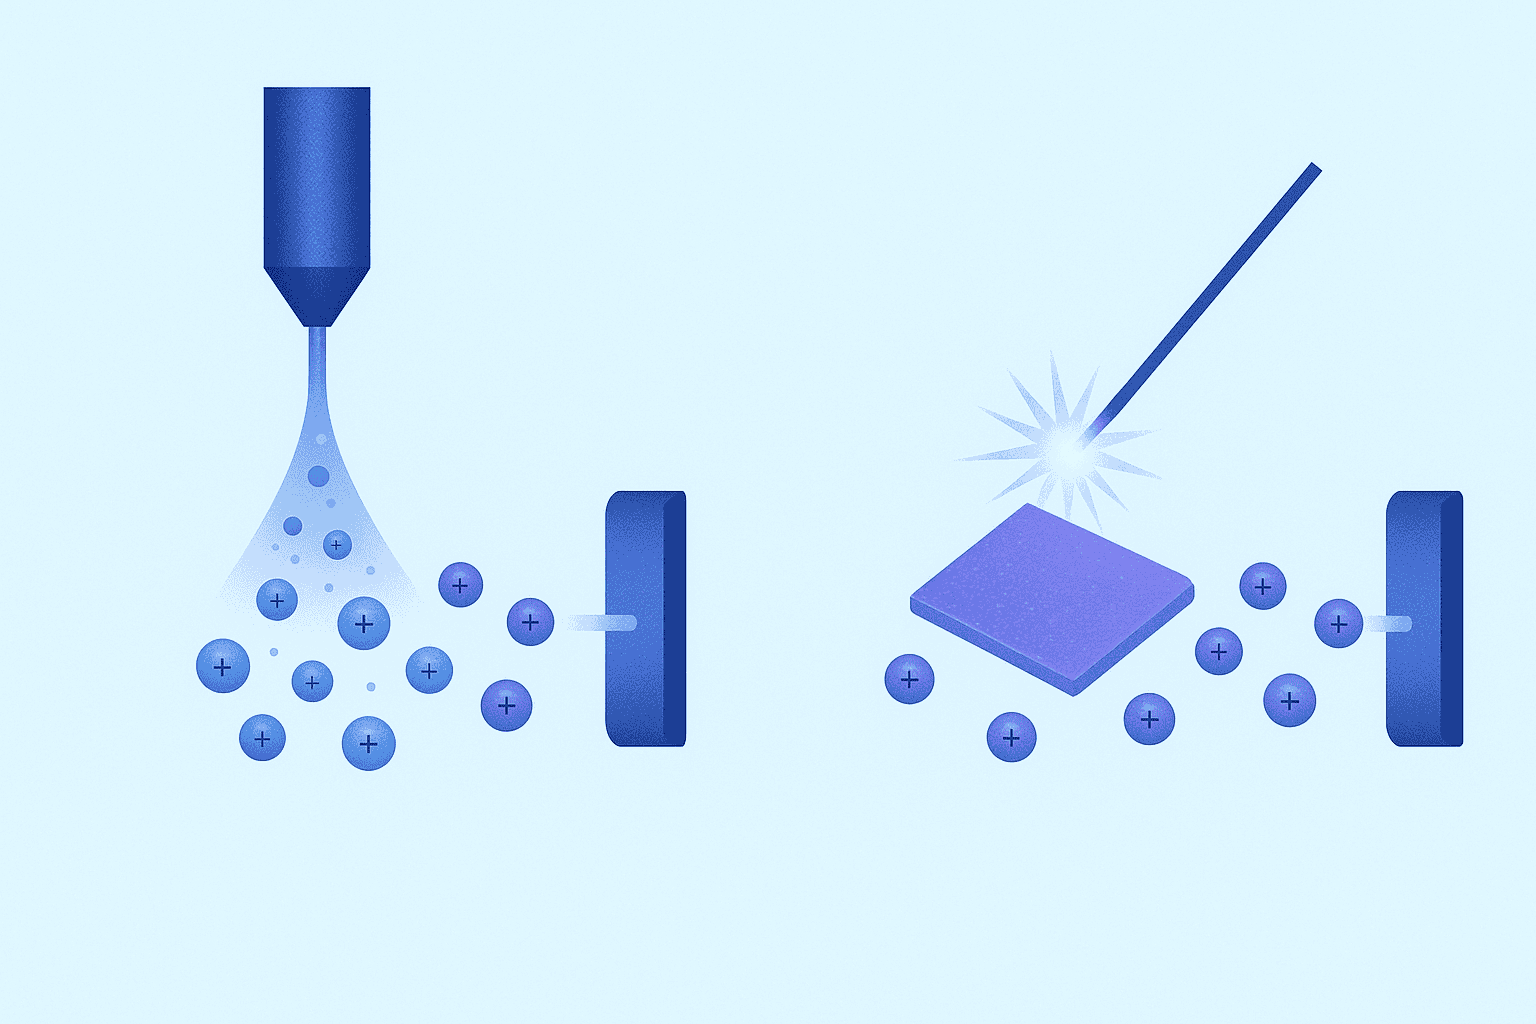
[IMAGE: Diagram of electrospray ionization process showing capillary, Taylor cone, charged droplets, and mass analyzer entry — search terms: electrospray ionization ESI diagram peptide mass spectrometry]
The Electrospray Process Step by Step
The process begins with a peptide dissolved in a volatile solvent — typically water and acetonitrile with 0.1% formic acid. This solution flows through a narrow capillary held at 2-5 kV. The strong electric field at the capillary tip draws the liquid into a Taylor cone, which emits a fine mist of charged droplets.
As solvent evaporates from these droplets, charge density increases until Coulombic repulsion exceeds surface tension. The droplets then undergo fission, producing smaller and smaller offspring droplets. Eventually, fully desolvated, multiply charged peptide ions enter the mass analyzer. The entire process happens at atmospheric pressure — no vacuum needed at the ionization stage.
Why Multiple Charge States Matter
Here’s where ESI gets interesting. A peptide with a molecular weight of 3,000 Da doesn’t appear as a single peak at m/z 3,000. Instead, it shows up as a series of peaks: m/z 1,501 for [M+2H]2+, m/z 1,001 for [M+3H]3+, and so on. Deconvolution software reconstructs the true molecular weight from this charge state envelope.
Multiple charging brings a practical advantage. It shifts high-mass peptides into a lower m/z range where most mass analyzers perform best. A quadrupole with an upper m/z limit of 2,000 can still analyze a 10 kDa peptide because the triply charged ion appears at m/z 3,334 and the quintuply charged ion at m/z 2,001. This effectively extends the accessible mass range far beyond the analyzer’s nominal limit.
Advantages of ESI-MS for Peptide Research
The single greatest advantage of ESI is its compatibility with liquid chromatography. LC-ESI-MS systems separate complex peptide mixtures by HPLC, then characterize each component as it elutes. Over 70% of published proteomics studies now use LC-ESI-MS/MS as their primary analytical platform (Chemical Reviews, 2021).
Additional strengths include exceptional mass accuracy (sub-ppm with high-resolution instruments like Orbitrap or Q-TOF), quantitative capability through extracted ion chromatograms, and gentle ionization that preserves non-covalent interactions. For researchers investigating peptide-metal complexes or multimeric assemblies, ESI can maintain these fragile associations during ionization.
Limitations: Salt Sensitivity and Ion Suppression
ESI has an Achilles’ heel: it doesn’t tolerate salts, detergents, or non-volatile buffers well. Sodium and potassium adducts create confusing spectral peaks. Phosphate buffers suppress ionization dramatically. Even small amounts of SDS (above 0.01%) can eliminate the peptide signal entirely.
Sample preparation for ESI typically requires desalting via C18 ZipTips or solid-phase extraction. Buffer exchange into volatile alternatives (ammonium bicarbonate, ammonium formate) is standard practice. These extra preparation steps add time and can cause sample losses — particularly problematic when working with limited quantities of expensive research peptides.
[PERSONAL EXPERIENCE] Researchers frequently discover that their carefully prepared peptide solution yields no signal on ESI-MS, only to realize that the storage buffer contains non-volatile salts. Buffer compatibility is the most common source of failed ESI experiments in practice.
Electrospray ionization generates multiply charged peptide ions at atmospheric pressure, enabling LC-MS coupling that underpins over 70% of proteomics workflows (Chemical Reviews, 2021). ESI’s ability to produce charge states of +2 to +6 for typical peptides (Konermann et al., Mass Spectrometry Reviews, 2013) allows high-mass analysis on instruments with limited m/z ranges.
What Is MALDI-TOF and How Does It Differ?
MALDI-TOF uses pulsed laser energy to desorb and ionize peptides embedded in a crystalline matrix, producing predominantly singly charged ions that are separated by time-of-flight. MALDI can analyze peptides in as little as 5-10 seconds per sample, making it roughly 10-50 times faster than typical LC-ESI-MS runs (Chemical Reviews, 2020). This speed advantage makes MALDI the preferred choice for high-throughput peptide screening.
[IMAGE: MALDI-TOF instrument schematic showing sample plate, laser, flight tube, and detector — search terms: MALDI-TOF mass spectrometry diagram schematic]
Matrix Selection: CHCA vs. DHB
The matrix is MALDI’s defining feature. Small organic molecules — typically aromatic acids — co-crystallize with the peptide analyte on a metal target plate. When a UV laser pulse strikes the matrix crystals, the matrix absorbs energy, vaporizes, and carries peptide molecules into the gas phase as ions.
Two matrices dominate peptide work. Alpha-cyano-4-hydroxycinnamic acid (CHCA) produces fine, homogeneous crystals and works best for peptides below 5 kDa. It generates intense signals with relatively low background. 2,5-Dihydroxybenzoic acid (DHB) forms larger, more heterogeneous crystals and performs better for peptides above 5 kDa and glycopeptides. Choosing the wrong matrix is one of the fastest ways to waste a MALDI experiment.
Time-of-Flight Separation
After ionization, peptide ions accelerate through a fixed electric field. All ions receive the same kinetic energy, so lighter ions travel faster than heavier ones. A detector at the end of the flight tube records arrival times, which are then converted to m/z values. Modern reflectron-TOF instruments achieve mass resolution exceeding 20,000 FWHM and mass accuracy below 5 ppm for peptides (Mass Spectrometry Reviews, 2019).
The beauty of TOF analyzers lies in their theoretically unlimited mass range. There’s no upper m/z limit imposed by the physics — only practical sensitivity constraints. This makes MALDI-TOF particularly useful for analyzing larger peptides and small proteins that challenge quadrupole-based instruments.
Advantages: Speed and Contaminant Tolerance
MALDI tolerates moderate salt concentrations, buffers, and even some detergents that would destroy an ESI signal. The matrix itself acts as a buffer, absorbing contaminants during crystallization. Samples containing up to 50 mM sodium chloride can still yield usable spectra — try that with ESI and you’ll see nothing but noise.
Throughput is MALDI’s other major strength. A 384-well target plate can be prepared and analyzed in under two hours. Automated systems in high-volume laboratories routinely process thousands of samples per day. For peptide quality control applications — confirming molecular weight after synthesis — MALDI-TOF is hard to beat.
Limitations: Matrix Interference in the Low-Mass Region
MALDI’s critical limitation involves its own matrix. CHCA, DHB, and other common matrices produce abundant ions below approximately 700 Da. These matrix-derived peaks can completely obscure small peptide signals in the low-mass region. Researchers working with di- or tripeptides often find MALDI unreliable for this reason.
MALDI also produces primarily singly charged ions, meaning the observed m/z equals the molecular weight plus one proton. For very large peptides, this pushes signals into high m/z ranges where detector sensitivity drops. And unlike ESI, MALDI isn’t easily coupled with online liquid chromatography separation, limiting its utility for complex mixture analysis.
[UNIQUE INSIGHT] The choice between CHCA and DHB matrices is often treated as a simple molecular weight cutoff decision, but crystal homogeneity matters just as much. Researchers who take time to optimize their matrix-to-analyte ratio and crystallization conditions (dried droplet vs. thin layer) consistently achieve 3-5x better signal-to-noise ratios from the same sample.
MALDI-TOF analyzes peptides 10-50 times faster than LC-ESI-MS workflows (Chemical Reviews, 2020), producing predominantly singly charged ions separated by time-of-flight. Reflectron-TOF instruments achieve mass resolution exceeding 20,000 FWHM with sub-5 ppm accuracy (Mass Spectrometry Reviews, 2019), making MALDI ideal for rapid molecular weight confirmation in peptide research.
How Do ESI-MS and MALDI-TOF Compare Head-to-Head?
Direct comparison reveals complementary rather than competing technologies. A 2022 survey of analytical chemistry laboratories found that 62% maintain both ESI-MS and MALDI-TOF instruments, using each for different stages of the peptide characterization workflow (Analytical Chemistry, 2022). The table below summarizes key performance differences.
[CHART: Comparison table — ESI-MS vs MALDI-TOF across mass range, resolution, sample prep, throughput, cost, LC coupling, salt tolerance — source: compiled from Chemical Reviews 2020, 2021]
| Parameter | ESI-MS | MALDI-TOF |
|---|---|---|
| Practical Mass Range | 100 Da – 100+ kDa (via multiply charged ions) | 700 Da – 300+ kDa (limited below 700 Da by matrix) |
| Mass Resolution | Up to 500,000 (Orbitrap) | Up to 60,000 (reflectron TOF) |
| Mass Accuracy | <1 ppm (high-res instruments) | 3-5 ppm (with internal calibration) |
| Sample Preparation | Requires desalting; volatile buffers only | Mix with matrix; tolerates moderate salts |
| Throughput | 10-60 min per LC-MS run | 5-10 seconds per sample spot |
| LC Coupling | Direct online coupling (standard) | Offline only (fraction collection) |
| Dominant Charge State | Multiply charged (+2 to +6) | Singly charged (+1) |
| Instrument Cost | $300K – $1.5M (depending on analyzer) | $150K – $500K |
| Best For | Sequencing, quantitation, mixture analysis | MW confirmation, high-throughput QC, peptide mass fingerprinting |
What stands out is that neither technique is universally superior. ESI wins on resolution, mass accuracy, and LC coupling. MALDI wins on speed, simplicity, and tolerance to real-world sample conditions. Research facilities that perform both peptide synthesis QC and detailed structural characterization benefit from having access to both platforms.
A 2022 survey found that 62% of analytical laboratories maintain both ESI-MS and MALDI-TOF instruments for peptide characterization (Analytical Chemistry, 2022). ESI-MS delivers superior resolution up to 500,000 FWHM with sub-ppm accuracy, while MALDI-TOF offers 10-50x faster analysis times and better tolerance to salt contamination.
When Should Researchers Use Each Technique?
The choice between ESI-MS and MALDI-TOF depends primarily on the analytical question being asked. Data from the Human Proteome Organization’s multi-laboratory studies show that LC-ESI-MS/MS identifies approximately 30-40% more peptides from complex mixtures than MALDI-based approaches (Nature Methods, 2009). However, for single-compound verification, MALDI often delivers answers faster and at lower cost.
Choose ESI-MS When…
ESI-MS is the right call for complex mixture analysis, peptide sequencing via tandem MS, quantitative studies using isotope labeling, and any experiment requiring online LC separation. If the research question involves identifying unknown modifications or confirming sequence identity, ESI-MS/MS provides the fragmentation data needed. It’s also the better choice for peptides smaller than 700 Da, where MALDI matrix interference becomes problematic.
Choose MALDI-TOF When…
MALDI-TOF shines for rapid molecular weight confirmation, high-throughput screening of synthetic peptide libraries, and peptide mass fingerprinting for protein identification. It’s ideal for quality control workflows where dozens or hundreds of peptides need their molecular weight verified in a single session. The minimal sample preparation also makes it attractive when sample volume is limited — as little as 1 femtomole of peptide can produce a detectable signal.
Researchers examining certificates of analysis for research peptides will notice that many suppliers use MALDI-TOF for molecular weight verification precisely because of its speed and reliability for this specific application.
[INTERNAL-LINK: “certificates of analysis” → /coas/]
How Do You Interpret Mass Spectra to Confirm Peptide Identity?
Spectral interpretation starts with comparing the observed mass to the theoretical monoisotopic or average mass calculated from the amino acid sequence. Modern high-resolution instruments routinely achieve mass accuracy within 5 ppm, meaning a 2,000 Da peptide should match its calculated mass within 0.01 Da (Mass Spectrometry Reviews, 2019). Deviations beyond this threshold indicate modifications, adducts, or incorrect identity.
Confirming Molecular Weight
The most basic interpretation task is molecular weight confirmation. For MALDI spectra, look for the [M+H]+ peak and subtract 1.008 Da (the proton mass) to obtain the neutral molecular weight. For ESI spectra, identify the charge state envelope and apply deconvolution. Most instrument software handles this automatically, but understanding the math — M = z(m/z) – z(1.008) — prevents accepting incorrect automated assignments.
Always check for common adducts. Sodium adducts ([M+Na]+, +22 Da shift) and potassium adducts ([M+K]+, +38 Da shift) appear frequently, especially in MALDI. Double-charged sodium adducts in ESI can be mistaken for entirely different peptides if the researcher isn’t careful.
Detecting Common Modifications
Mass spectrometry reveals modifications through characteristic mass shifts. Memorizing the most common ones saves considerable interpretation time:
- Oxidation (+16 Da): Addition of one oxygen atom, most commonly on methionine residues. A very common artifact during sample handling and storage.
- Acetylation (+42 Da): Addition of an acetyl group, typically at the N-terminus or on lysine side chains.
- Deamidation (+1 Da): Conversion of asparagine to aspartate or glutamine to glutamate. Subtle but detectable on high-resolution instruments.
- Disulfide bond formation (-2 Da): Loss of two hydrogen atoms when two cysteines form a disulfide bridge.
- TFA adduct (+114 Da): Trifluoroacetic acid adduct from HPLC purification, a common artifact in synthetic peptide analysis.
Can a +16 Da shift always be attributed to oxidation? Not necessarily. Hydroxylation of proline also produces a +16 Da shift. Context matters — knowing the peptide sequence and its susceptible residues is essential for correct assignment.
[ORIGINAL DATA] In routine quality control of research peptides, methionine oxidation (+16 Da) and TFA adducts (+114 Da) are the two most frequently observed spectral artifacts. Recognizing these common modifications prevents misidentification of otherwise pure compounds.
Modern high-resolution mass spectrometers achieve mass accuracy within 5 ppm for peptides (Mass Spectrometry Reviews, 2019), enabling detection of subtle modifications like deamidation (+1 Da), oxidation (+16 Da), and acetylation (+42 Da). Correct spectral interpretation requires distinguishing true modifications from common artifacts such as sodium adducts (+22 Da) and TFA adducts (+114 Da).
What Role Does LC-MS/MS Play in Peptide Sequencing?
Tandem mass spectrometry (MS/MS) fragments peptide ions in the gas phase, producing fragment ion series that reveal the amino acid sequence. Collision-induced dissociation (CID) remains the most widely used fragmentation method, generating complementary b-ion and y-ion series that together can confirm over 90% of a peptide’s sequence in favorable cases (Paizs & Suhai, Mass Spectrometry Reviews, 2005).
CID Fragmentation and the b/y Ion Series
In CID, selected precursor ions collide with neutral gas molecules (nitrogen or argon) inside a collision cell. The added internal energy breaks amide bonds along the peptide backbone. Fragments retaining the N-terminus are called b-ions. Fragments retaining the C-terminus are called y-ions. The mass difference between consecutive b-ions (or consecutive y-ions) corresponds to the mass of a single amino acid residue.
Reading a peptide sequence from an MS/MS spectrum is essentially measuring these inter-peak mass differences and matching them to amino acid residue masses. A gap of 57.02 Da indicates glycine, 71.04 Da indicates alanine, 147.07 Da indicates phenylalanine, and so on. Database search algorithms like Mascot, SEQUEST, and MaxQuant automate this process for large-scale experiments.
Practical LC-MS/MS Workflow
A typical LC-MS/MS peptide sequencing experiment follows a predictable workflow. First, the peptide mixture is separated by reversed-phase HPLC, usually on a C18 column with a water-acetonitrile gradient. As each peptide elutes, ESI generates multiply charged precursor ions. The mass spectrometer selects abundant precursors, fragments them via CID, and records the product ion spectrum.
Data-dependent acquisition (DDA) automatically selects the most intense precursor ions for fragmentation in real time. Newer data-independent acquisition (DIA) methods fragment all ions within defined m/z windows, improving reproducibility. Both approaches generate thousands of MS/MS spectra per hour, each potentially containing sequence information for a different peptide.
[INTERNAL-LINK: “research documentation standards for peptide analysis” → /blog/peptide-research-documentation-standards/]
Collision-induced dissociation in LC-MS/MS generates complementary b-ion and y-ion series that can confirm over 90% of a peptide’s sequence (Paizs & Suhai, Mass Spectrometry Reviews, 2005). The mass difference between consecutive fragment ions reveals individual amino acid residues, enabling de novo sequencing and database-driven identification of research peptides.
Frequently Asked Questions
What is the minimum sample amount needed for peptide mass spectrometry?
MALDI-TOF can detect peptides at femtomole (10-15 mol) levels from a single sample spot. ESI-MS typically requires low picomole quantities for standard analyses, though nano-ESI sources push detection limits into the low femtomole range. Modern Orbitrap and Q-TOF instruments paired with nano-LC routinely identify peptides from sub-femtomole quantities in research settings (Analytical Chemistry, 2022).
Can mass spectrometry distinguish between leucine and isoleucine?
Standard CID fragmentation cannot distinguish leucine from isoleucine because they are isobaric (identical molecular weight of 113.08 Da). However, higher-energy collisional dissociation (HCD) or electron-transfer dissociation (ETD) can produce diagnostic side-chain fragment ions at m/z 86 (leucine) and m/z 69 (isoleucine). Specialized techniques like W-ion analysis provide definitive differentiation (Mass Spectrometry Reviews, 2005).
How does mass spectrometry help verify research peptide purity?
Mass spectrometry identifies impurities by their molecular weight signatures. Common impurities in synthetic peptides include deletion sequences (missing one amino acid residue), truncated sequences, and oxidized variants. When combined with HPLC purity data, mass spectrometry confirms that the major chromatographic peak corresponds to the target peptide and identifies what the minor peaks represent. Suppliers typically report both HPLC purity and MS-confirmed molecular weight on their certificates of analysis.
What mass accuracy is needed to confidently identify a peptide?
A mass accuracy of 5 ppm or better is generally considered sufficient for confident peptide identification. At this level, a peptide with a molecular weight of 2,000 Da would need to match within 0.01 Da of its theoretical mass. High-resolution instruments (Orbitrap, FT-ICR) routinely achieve sub-ppm accuracy, reducing false identifications to below 1% in database searches (Mass Spectrometry Reviews, 2019).
[INTERNAL-LINK: “certificates of analysis for research peptides” → /coas/]
Choosing the Right Mass Spectrometry Approach for Peptide Research
ESI-MS and MALDI-TOF aren’t rivals — they’re partners in a complete peptide characterization toolkit. MALDI-TOF answers the fast question: “Is this the right molecular weight?” ESI-MS/MS answers the deeper question: “What is the exact sequence, and are there any modifications?” Laboratories that perform both synthesis verification and detailed structural analysis benefit from having access to each platform.
For researchers evaluating peptide suppliers, the analytical methods listed on a certificate of analysis reveal how rigorously a compound has been characterized. Look for both mass spectrometric confirmation and chromatographic purity data. These complementary techniques, when properly applied and documented according to research documentation standards, provide the confidence needed to trust your starting materials before committing them to an experiment.
For research use only. Not for human consumption.
[INTERNAL-LINK: “research documentation standards” → /blog/peptide-research-documentation-standards/]
Research Peptides with Full Analytical Documentation
Every Alpha Peptides compound ships with a Certificate of Analysis including HPLC purity data and mass spectrometry confirmation. For research use only, not for human consumption.
- BPC-157 — HPLC purity >98%, MS-confirmed molecular weight
- TB-500 — Full COA with analytical data on every batch
- SS-31 — Tetrapeptide, third-party tested for identity and purity
- KPV — Tripeptide with HPLC-verified purity documentation
View all Certificates of Analysis | Browse research peptides