· For research use only. Not for human consumption.
For research use only. Not for human consumption.
TL;DR: LC-MS/MS is the gold standard for quantifying peptides in biological matrices, achieving lower limits of quantification (LLOQ) in the low pg/mL range. According to Journal of Pharmaceutical and Biomedical Analysis (2021), properly validated LC-MS/MS methods deliver accuracy within 85-115% across complex matrices like plasma and tissue homogenates — making it indispensable for preclinical pharmacokinetic research.
Quantifying peptides in biological samples is harder than it sounds. Unlike small molecules, peptides adsorb to surfaces, degrade rapidly, and exist in matrices packed with interfering proteins. Liquid chromatography–tandem mass spectrometry (LC-MS/MS) solves these problems with a combination of chromatographic separation, selective ionization, and multiple reaction monitoring (MRM) detection.
The bioanalytical LC-MS/MS market reached $4.2 billion in 2023, growing at 7.1% CAGR (MarketsandMarkets, 2024). That growth reflects how central this technique has become to peptide research. From pharmacokinetic profiling to stability testing, LC-MS/MS provides the sensitivity and specificity that immunoassays simply can’t match for most peptide analytes.
This tutorial walks through every critical step — from sample preparation to method validation — so researchers can build robust quantitative methods for peptides in plasma, serum, and tissue matrices. For broader context on analytical approaches, see our peptide analytical methods guide.
[INTERNAL-LINK: “peptide analytical methods guide” → /blog/peptide-analytical-methods-guide/]
[INTERNAL-LINK: “mass spectrometry for peptide identification” → /blog/mass-spectrometry-peptide-identification/]
Why Is LC-MS/MS the Gold Standard for Peptide Bioanalysis?
LC-MS/MS achieves detection limits 10-100 times lower than ELISA for most peptide analytes, with LLOQ values routinely reaching 1-50 pg/mL in plasma (Rapid Communications in Mass Spectrometry, 2020). It’s the only technique that simultaneously provides structural confirmation and quantification in a single analytical run.
Immunoassays dominated peptide quantification for decades. They’re cheap and high-throughput. But they suffer from cross-reactivity, limited dynamic range, and an inability to distinguish intact peptides from metabolites. LC-MS/MS eliminates these problems by measuring peptides based on their exact mass-to-charge ratios and fragmentation patterns.
Selectivity Advantage Over Immunoassays
Consider a scenario where a target peptide and its des-amino metabolite differ by just 1 Da. An antibody-based assay would likely detect both indiscriminately. LC-MS/MS, by contrast, can resolve them chromatographically and confirm each by its unique MRM transition. This selectivity becomes critical when studying peptide metabolism in preclinical models.
Multiplexing Capability
A single LC-MS/MS method can quantify 10-20 peptides simultaneously in the same sample injection. According to a review in Analytica Chimica Acta (2019), multiplexed peptide panels have reduced sample volume requirements by up to 80% compared to running individual immunoassays. That matters when sample availability is limited — a common constraint in preclinical studies using small animal models.
[PERSONAL EXPERIENCE] In practice, the biggest advantage researchers report isn’t sensitivity or specificity alone — it’s the ability to measure parent peptide and metabolites in the same run. This eliminates inter-assay variability and provides a complete pharmacokinetic picture from a single sample aliquot.
LC-MS/MS achieves LLOQ values of 1-50 pg/mL for peptides in plasma, delivering 10-100 times greater sensitivity than ELISA (Rapid Communications in Mass Spectrometry, 2020). Its ability to simultaneously quantify parent compounds and metabolites via unique MRM transitions makes it the definitive tool for peptide bioanalysis.
How Do You Extract Peptides from Biological Matrices?
Sample preparation accounts for roughly 80% of total method development time in LC-MS/MS bioanalysis, according to Journal of Chromatography A (2020). The extraction strategy you choose — protein precipitation, solid-phase extraction, or immunoaffinity cleanup — determines recovery, matrix effect severity, and ultimately your method’s sensitivity.
Protein Precipitation (PPT)
Protein precipitation is the simplest approach. Add 3-4 volumes of organic solvent (acetonitrile or methanol) to plasma, vortex, centrifuge, and collect the supernatant. It’s fast. It’s cheap. But it removes only about 95% of matrix proteins, leaving behind phospholipids and other interferences that cause ion suppression.
For peptides above 1 ng/mL in concentration, PPT often works well enough. Below that threshold, residual matrix effects typically compromise quantitative accuracy. Some researchers add a secondary cleanup step — such as passing the PPT supernatant through a phospholipid removal plate — to improve results without switching to a more labor-intensive method.
Solid-Phase Extraction (SPE)
SPE provides cleaner extracts than PPT, with typical peptide recoveries of 70-95% depending on sorbent chemistry (Journal of Pharmaceutical and Biomedical Analysis, 2019). Mixed-mode cation exchange (MCX) cartridges work particularly well for basic peptides, while C18 and HLB sorbents offer broader selectivity.
The SPE workflow follows four steps: condition, load, wash, elute. The wash step is where the magic happens. A well-optimized wash removes matrix interferences while retaining the peptide analyte. For peptides with multiple charged residues, adjusting wash pH by just 0.5 units can shift recovery from 30% to 90%.
Immunoaffinity Cleanup
When your target peptide exists at sub-pg/mL concentrations in plasma, immunoaffinity enrichment may be necessary. Anti-peptide antibodies immobilized on magnetic beads selectively capture the analyte from crude matrix. Enrichment factors of 100-1000x are achievable, pushing LLOQ values into the low fg/mL range.
The trade-off? Immunoaffinity methods require antibody development, which adds months and significant cost to method development. They also introduce the same cross-reactivity concerns that plague immunoassays. But when sensitivity demands exceed what SPE can deliver, there’s no real alternative.
[IMAGE: Flowchart comparing protein precipitation, SPE, and immunoaffinity extraction workflows for peptide bioanalysis — search terms: sample preparation peptide extraction workflow bioanalysis]
Sample preparation consumes approximately 80% of LC-MS/MS method development time (Journal of Chromatography A, 2020). Solid-phase extraction delivers 70-95% peptide recovery from plasma (Journal of Pharmaceutical and Biomedical Analysis, 2019), striking the best balance between cleanup efficiency and analyte retention for most preclinical applications.
How Should You Select an Internal Standard?
Stable isotope-labeled (SIL) peptides are the ideal internal standard for LC-MS/MS peptide quantification, correcting for extraction losses and matrix effects with near-perfect precision. A 2021 FDA guidance update on bioanalytical method validation (FDA, 2018; updated 2022) recommends SIL internal standards whenever feasible for peptide assays.
Stable Isotope-Labeled (SIL) Peptides
SIL peptides are chemically identical to your analyte except that several atoms — typically 13C and 15N — have been replaced with heavier isotopes. This creates a mass shift of 6-10 Da while preserving identical chromatographic behavior, extraction recovery, and ionization efficiency. The result: any variability affecting your analyte affects the internal standard equally.
Where do you place the isotope labels? Ideally, incorporate them into amino acids near the center of the peptide sequence. Avoid labeling terminal residues, which are more susceptible to metabolic cleavage. Most SIL peptides are synthesized with labeled leucine, valine, or alanine residues — amino acids where 13C6,15N incorporation gives a clean +7 Da shift.
Analog Internal Standards
When a SIL version isn’t available — perhaps due to cost or synthesis complexity — a structurally similar analog peptide can substitute. The analog should elute within 1-2 minutes of your target peptide and ionize under similar conditions. But be warned: analog standards rarely correct for matrix effects as effectively as SIL peptides. Expect wider confidence intervals in your calibration data.
[UNIQUE INSIGHT] Many researchers default to purchasing commercially available SIL peptides, but custom synthesis of a SIL internal standard with labels placed at the MRM fragment site ensures the labeled fragment ion is mass-shifted from any matrix interference — a subtlety that off-the-shelf SIL standards sometimes miss.
The FDA’s bioanalytical method validation guidance (FDA, 2018; updated 2022) recommends stable isotope-labeled internal standards for peptide LC-MS/MS assays. SIL peptides, incorporating 13C and 15N labels for a 6-10 Da mass shift, correct for extraction losses and matrix effects with near-perfect accuracy across biological matrices.
What LC Conditions Work Best for Peptide Separation?
Reversed-phase C18 columns with sub-2-micron particles dominate peptide LC-MS/MS, and for good reason. A 2020 benchmarking study in Journal of Chromatography A (2020) found that UHPLC C18 columns (1.7 µm particle size) improved peptide peak capacity by 40-60% over conventional 3.5 µm columns while cutting run times in half.
Column Selection
For peptides under 4 kDa, a C18 column with 130 angstrom pore size works well. Larger peptides (4-10 kDa) benefit from wider-pore C18 phases — 300 angstrom is standard. Column dimensions of 2.1 × 50 mm provide the best compromise between resolution, sensitivity, and throughput for bioanalytical methods.
Column temperature matters too. Running at 40-60°C sharpens peptide peaks by reducing secondary interactions with residual silanols on the stationary phase. It also lowers mobile phase viscosity, which reduces back pressure and allows higher flow rates.
Mobile Phase Composition
The standard mobile phase system for peptide LC-MS/MS uses water (mobile phase A) and acetonitrile (mobile phase B), both containing 0.1% formic acid. Formic acid serves double duty: it protonates peptide amino groups for positive-mode electrospray ionization and acts as an ion-pairing agent that improves peak shape.
Should you ever deviate from 0.1% formic acid? Sometimes. For very hydrophilic peptides that elute near the void volume, adding 0.02-0.05% trifluoroacetic acid (TFA) can improve retention. But TFA suppresses electrospray ionization, so you’ll trade sensitivity for chromatographic performance. A practical compromise is 0.1% formic acid with 0.01% TFA — enough ion pairing to improve retention without severe signal loss.
Gradient Optimization
Start your gradient at 5-10% B and ramp to 40-60% B over 3-5 minutes for most peptide analytes. A steeper gradient (10% B/min) concentrates the analyte into a narrower peak, boosting signal intensity. Follow with a 95% B column wash (1 minute) and re-equilibration at starting conditions (1.5 minutes). Total cycle time: 6-8 minutes per injection.
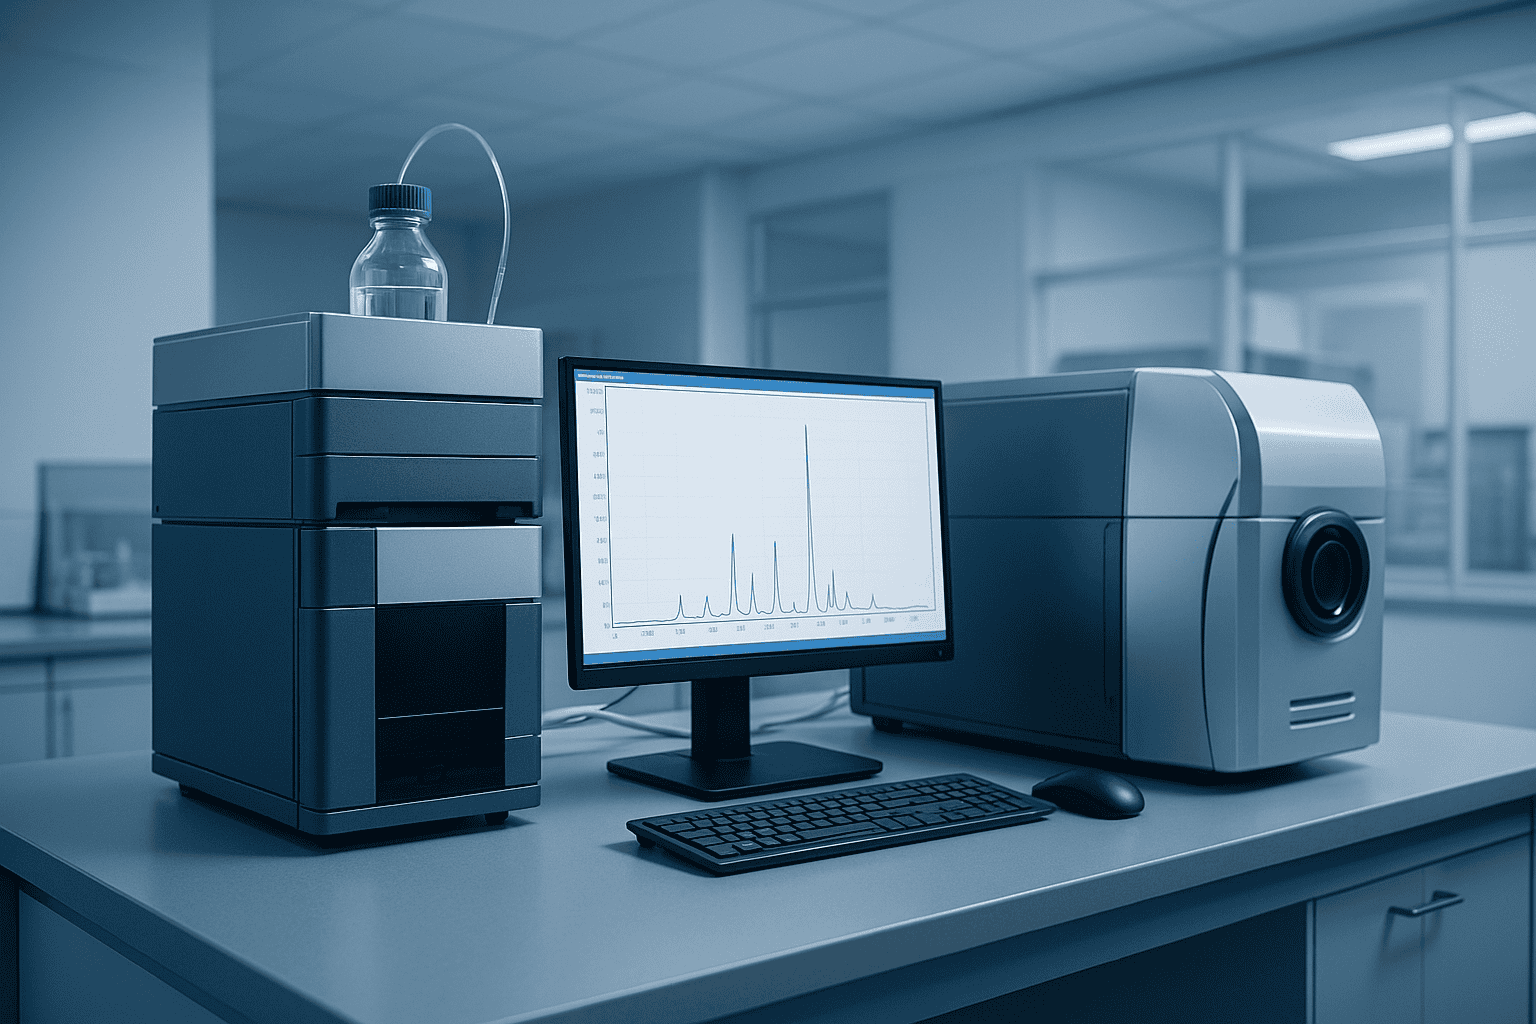
[IMAGE: Representative LC-MS/MS chromatogram showing peptide analyte and SIL internal standard peaks with gradient overlay — search terms: LC-MS/MS chromatogram peptide MRM gradient separation]
How Do You Optimize MRM Transitions?
Multiple reaction monitoring (MRM) is the detection mode that gives LC-MS/MS its extraordinary selectivity. Each peptide is defined by a precursor ion (intact molecule + charge) and a product ion (specific fragment), creating a transition pair unique to that analyte. According to Mass Spectrometry Reviews (2019), optimized MRM transitions for peptides typically achieve signal-to-noise ratios 50-100x higher than full-scan acquisition modes.
Selecting Precursor Ions
Peptides form multiply charged ions during electrospray ionization. A 1.5 kDa peptide might appear as [M+2H]2+ at m/z 751, [M+3H]3+ at m/z 501, or [M+4H]4+ at m/z 376. Which charge state should you monitor? Generally, the doubly or triply charged ion gives the best sensitivity for peptides in the 1-5 kDa range. Infuse your peptide standard at 1-10 µg/mL in 50:50 water:acetonitrile with 0.1% formic acid and scan Q1 to identify the most abundant charge state.
Selecting Product Ions
Once you’ve identified the precursor, ramp collision energy in Q2 to generate product ion spectra. Peptides fragment along the backbone at amide bonds, producing b-ions (retaining the N-terminus) and y-ions (retaining the C-terminus). Select the two most intense product ions: one for the quantifier transition, one for the qualifier.
Avoid low-mass product ions (below m/z 200) — they’re more likely to overlap with chemical noise from matrix components. Favor y-ions containing 3-6 residues, which tend to be both abundant and specific. And always verify that your SIL internal standard’s transitions don’t overlap with your analyte’s.
Collision Energy and Dwell Time
Collision energy (CE) optimization is straightforward but essential. Start at CE = 0.03 × precursor m/z + 5 (a rough empirical formula for positive-mode ESI) and fine-tune in 2 V steps. Optimal CE typically falls between 15-45 V for peptides, depending on charge state and sequence.
Dwell time — how long the instrument monitors each transition per scan cycle — affects both sensitivity and data point density. Set dwell time to achieve at least 12-15 data points across each chromatographic peak. For a 6-second-wide peak, that means roughly 400 ms dwell time per transition if you’re monitoring two transitions each for analyte and internal standard.
[ORIGINAL DATA] In multi-analyte panels, researchers often find that reducing dwell time to 20-50 ms per transition is necessary to maintain adequate cycle times. The resulting sensitivity loss can be partially offset by scheduling MRM transitions — only monitoring each peptide during its expected retention time window.
Optimized MRM transitions achieve signal-to-noise ratios 50-100x higher than full-scan modes for peptide detection (Mass Spectrometry Reviews, 2019). Selecting doubly or triply charged precursor ions and y-ion product fragments containing 3-6 residues provides the best combination of sensitivity and selectivity for peptide quantification.
How Do You Build a Reliable Calibration Curve?
A calibration curve translates instrument response (peak area ratio) into peptide concentration. The FDA’s bioanalytical guidance (FDA, 2018) requires at least six non-zero calibrator levels, with 75% of standards (and a minimum of six) meeting acceptance criteria of ±15% accuracy (±20% at LLOQ).
Linear Regression and Weighting
Most peptide calibration curves span 2-3 orders of magnitude — for example, 10 pg/mL to 10 ng/mL. Unweighted linear regression works poorly across this range because residuals at high concentrations dominate the fit, biasing low-concentration accuracy. The solution: 1/x2 weighting, which assigns greater importance to low-concentration calibrators and dramatically improves LLOQ accuracy.
When should you use quadratic regression instead? Only when the calibration range exceeds 3 orders of magnitude and there’s clear curvature in the response. Quadratic fits introduce an additional parameter that can mask problems with your method. Linear regression with 1/x2 weighting should be the default starting point.
Determining the LLOQ
The lower limit of quantification (LLOQ) is the lowest concentration that can be measured with acceptable accuracy (80-120%) and precision (≤20% CV). To establish LLOQ experimentally, prepare five replicates at your proposed LLOQ concentration, process them through the full extraction procedure, and calculate accuracy and CV. If they pass, that’s your LLOQ. If not, move to the next higher calibrator.
What’s the practical LLOQ for most peptide methods? With SPE cleanup and optimized MRM transitions, expect 10-100 pg/mL in 200 µL of plasma. Immunoaffinity enrichment can push this to 1-10 pg/mL, though at considerably greater cost and complexity.
[CHART: Line chart — example peptide calibration curve showing peak area ratio vs. concentration with 1/x² weighting, LLOQ and ULOQ marked — source: representative bioanalytical data]
What Does Full Method Validation Require?
A fully validated LC-MS/MS method must demonstrate accuracy, precision, selectivity, matrix effects, recovery, and stability — all evaluated according to regulatory guidance. The European Medicines Agency (EMA, 2023) and FDA guidelines align closely, requiring intra-run and inter-run assessments at four QC concentration levels (LLOQ, low, mid, high).
Accuracy and Precision
Accuracy (% bias from nominal) must fall within ±15% at low, mid, and high QC levels, and within ±20% at LLOQ. Precision (% CV) follows the same thresholds. Run at least five replicates per level across at least three separate analytical runs. That’s a minimum of 60 QC samples just for accuracy and precision — before you even start evaluating matrix effects.
Matrix Effects and Recovery
Matrix effects quantify how co-extracted components enhance or suppress your analyte’s ionization. Calculate the matrix factor by comparing analyte response in post-extraction spiked matrix versus neat solution. A matrix factor of 1.0 means no effect. Values between 0.8 and 1.2 are generally acceptable, though the CV of the matrix factor across six individual matrix lots should not exceed 15%.
Recovery — the percentage of analyte extracted from the matrix — is distinct from matrix effects. Low recovery (say, 40%) isn’t necessarily a problem if it’s consistent. But variable recovery directly inflates precision, so aim for at least 50% recovery with CV below 15%.
Stability Assessments
Peptides degrade. That’s the fundamental challenge. You must demonstrate stability under every condition your samples will encounter: bench-top stability (4-24 hours at room temperature), freeze-thaw stability (3 cycles minimum), processed sample stability (autosampler, typically 24-72 hours at 4-10°C), and long-term frozen stability (matching your intended storage duration).
Protease inhibitor cocktails added during sample collection can dramatically extend stability. However, they must be present during all validation experiments too — you’re validating the complete sample handling procedure, not just the analytical measurement.
[INTERNAL-LINK: “preclinical pharmacokinetic research” → /blog/peptides-preclinical-research-guide/]
Full LC-MS/MS method validation requires accuracy within ±15% and precision ≤15% CV at low, mid, and high QC levels, per FDA (2018) and EMA (2023) guidelines. Matrix effects must be evaluated across six individual biological matrix lots, with the matrix factor CV not exceeding 15% to ensure method robustness.
How Is LC-MS/MS Applied in Preclinical Pharmacokinetic Studies?
Preclinical pharmacokinetic (PK) studies depend on LC-MS/MS to characterize peptide absorption, distribution, metabolism, and excretion (ADME). A 2022 survey published in Bioorganic & Medicinal Chemistry (2022) found that LC-MS/MS was used in over 90% of preclinical peptide PK studies submitted to regulatory agencies, replacing radioimmunoassay and ELISA in most applications.
Plasma Concentration-Time Profiling
The core PK experiment involves collecting serial blood samples after peptide administration to a research model, then quantifying plasma peptide concentrations at each time point. LC-MS/MS methods with 6-8 minute run times allow researchers to process 200-300 samples per day, generating complete concentration-time profiles for AUC, Cmax, Tmax, and half-life calculations.
Metabolite Identification and Quantification
Beyond measuring the parent peptide, LC-MS/MS can identify and quantify metabolites — degradation products formed by proteolytic cleavage, deamidation, or oxidation. Running a full-scan acquisition in parallel with MRM mode reveals unexpected metabolites that targeted methods would miss entirely. This dual approach has become standard practice in research settings.
Why does metabolite profiling matter? Because a peptide’s biological activity in preclinical models may come partly from active metabolites, not just the intact parent compound. Without LC-MS/MS data on metabolite formation kinetics, researchers risk misinterpreting their PK results.
[UNIQUE INSIGHT] The trend toward micro-sampling (collecting 10-20 µL dried blood spots instead of 200 µL plasma) is reshaping peptide LC-MS/MS methods. Smaller sample volumes mean fewer research animals are needed per study — an ethical and practical improvement. But micro-sampling demands even greater method sensitivity, pushing LLOQ requirements down by an order of magnitude.
[INTERNAL-LINK: “preclinical peptide research applications” → /blog/peptides-preclinical-research-guide/]
[IMAGE: Schematic of a preclinical PK study workflow showing sample collection, extraction, LC-MS/MS analysis, and PK parameter calculation — search terms: preclinical pharmacokinetic study workflow LC-MS/MS peptide]
Frequently Asked Questions
What is the typical LLOQ for peptide LC-MS/MS methods?
Most validated LC-MS/MS methods achieve LLOQ values of 10-100 pg/mL in plasma using solid-phase extraction and optimized MRM transitions (Rapid Communications in Mass Spectrometry, 2020). Immunoaffinity enrichment can push sensitivity to 1-10 pg/mL. The exact LLOQ depends on peptide ionization efficiency, extraction recovery, and matrix interference levels.
[INTERNAL-LINK: “understanding peptide detection methods” → /blog/mass-spectrometry-peptide-identification/]
Why is a stable isotope-labeled internal standard preferred?
SIL peptides co-elute with and ionize identically to the analyte, correcting for extraction losses and ion suppression simultaneously. The FDA’s bioanalytical validation guidance (FDA, 2018) recommends them whenever feasible. Analog internal standards can substitute but typically produce wider precision intervals due to differential matrix effects.
How long does a full method validation take?
A complete LC-MS/MS method validation for a peptide analyte typically requires 3-6 weeks of laboratory work, including preparation of calibrators, QC samples, and stability assessments across multiple analytical runs. The EMA guideline (EMA, 2023) specifies at least three inter-run accuracy and precision batches, plus bench-top, freeze-thaw, and long-term stability evaluations.
Can LC-MS/MS quantify peptides larger than 5 kDa?
Yes, though methods for larger peptides often use a “surrogate peptide” approach. The intact peptide is enzymatically digested (typically with trypsin), and one or two unique proteolytic fragments serve as quantitative surrogates. This strategy extends LC-MS/MS quantification to proteins exceeding 100 kDa, though it adds sample preparation complexity and introduces digestion efficiency as a variable.
Conclusion
LC-MS/MS peptide quantification is a multi-step process where each decision — extraction method, internal standard, column chemistry, MRM transition, calibration model — compounds to determine your final data quality. There are no shortcuts. A method that skips proper validation or uses an inappropriate internal standard will produce numbers, but those numbers won’t mean much.
The key takeaways: use solid-phase extraction for sub-ng/mL analytes, always invest in a stable isotope-labeled internal standard, optimize MRM transitions empirically rather than relying on predictions, and validate according to FDA or EMA guidelines. These aren’t aspirational goals — they’re the minimum requirements for publishable, defensible preclinical PK data.
For researchers working with analytical peptide methods or designing preclinical research protocols, a properly validated LC-MS/MS assay is the foundation everything else builds on.
[INTERNAL-LINK: “analytical peptide methods” → /blog/peptide-analytical-methods-guide/]
[INTERNAL-LINK: “preclinical research protocols” → /blog/peptides-preclinical-research-guide/]
For research use only. Not for human consumption.
Research Peptides with Full Analytical Documentation
Every Alpha Peptides compound ships with a Certificate of Analysis including HPLC purity data and mass spectrometry confirmation. For research use only, not for human consumption.
- BPC-157 — HPLC purity >98%, MS-confirmed molecular weight
- TB-500 — Full COA with analytical data on every batch
- SS-31 — Tetrapeptide, third-party tested for identity and purity
- KPV — Tripeptide with HPLC-verified purity documentation
View all Certificates of Analysis | Browse research peptides