· For research use only. Not for human consumption.
For research use only. Not for human consumption.
Capillary Electrophoresis for Peptide Analysis: A Primer
Most researchers reach for HPLC when analyzing peptide purity. It’s the default — and for good reason. But HPLC has blind spots. Deamidated variants, isomerized residues, and other closely related impurities can co-elute, hiding behind a single peak. Capillary electrophoresis (CE) separates by a fundamentally different mechanism and catches what reversed-phase chromatography misses.
CE has earned a growing role in peptide quality control. According to a 2021 review in Electrophoresis (Stolz et al., 2021), CE-based methods now appear in over 30% of European Pharmacopoeia peptide monographs. That adoption reflects real analytical advantages: higher separation efficiency, orthogonal selectivity, and dramatically lower solvent consumption. For research laboratories evaluating peptide purity, CE offers a complementary — sometimes superior — perspective.
This primer covers the underlying principles, practical modes for peptide separation, method development basics, and how CE compares with HPLC. If you’re building foundational knowledge, start with our analytical methods overview first.
[INTERNAL-LINK: “analytical methods overview” → /blog/peptide-analytical-methods-guide/]
[INTERNAL-LINK: “peptide purity assessment” → /blog/read-hplc-chromatogram-peptide-purity/]
TL;DR: Capillary electrophoresis separates peptides based on charge-to-size ratio, offering separation efficiencies exceeding 500,000 theoretical plates — roughly 10x higher than typical HPLC columns (Electrophoresis, 2021). CE excels at resolving closely related impurities like deamidated or isomerized peptide variants that co-elute in reversed-phase HPLC. For research use only.
How Does Capillary Electrophoresis Work?
Capillary electrophoresis separates analytes based on their electrophoretic mobility — a function of charge and hydrodynamic size — inside a narrow fused-silica capillary, typically 25–75 µm internal diameter. CE routinely generates over 500,000 theoretical plates per meter of capillary length (Analytical Chemistry, 2021), far exceeding what packed HPLC columns achieve.
Two forces govern analyte movement inside the capillary. The first is electrophoretic mobility: charged molecules migrate toward the electrode of opposite polarity when voltage is applied. Smaller, more highly charged species move faster. The second is electroosmotic flow (EOF), a bulk flow of liquid caused by the charged inner surface of the silica capillary.
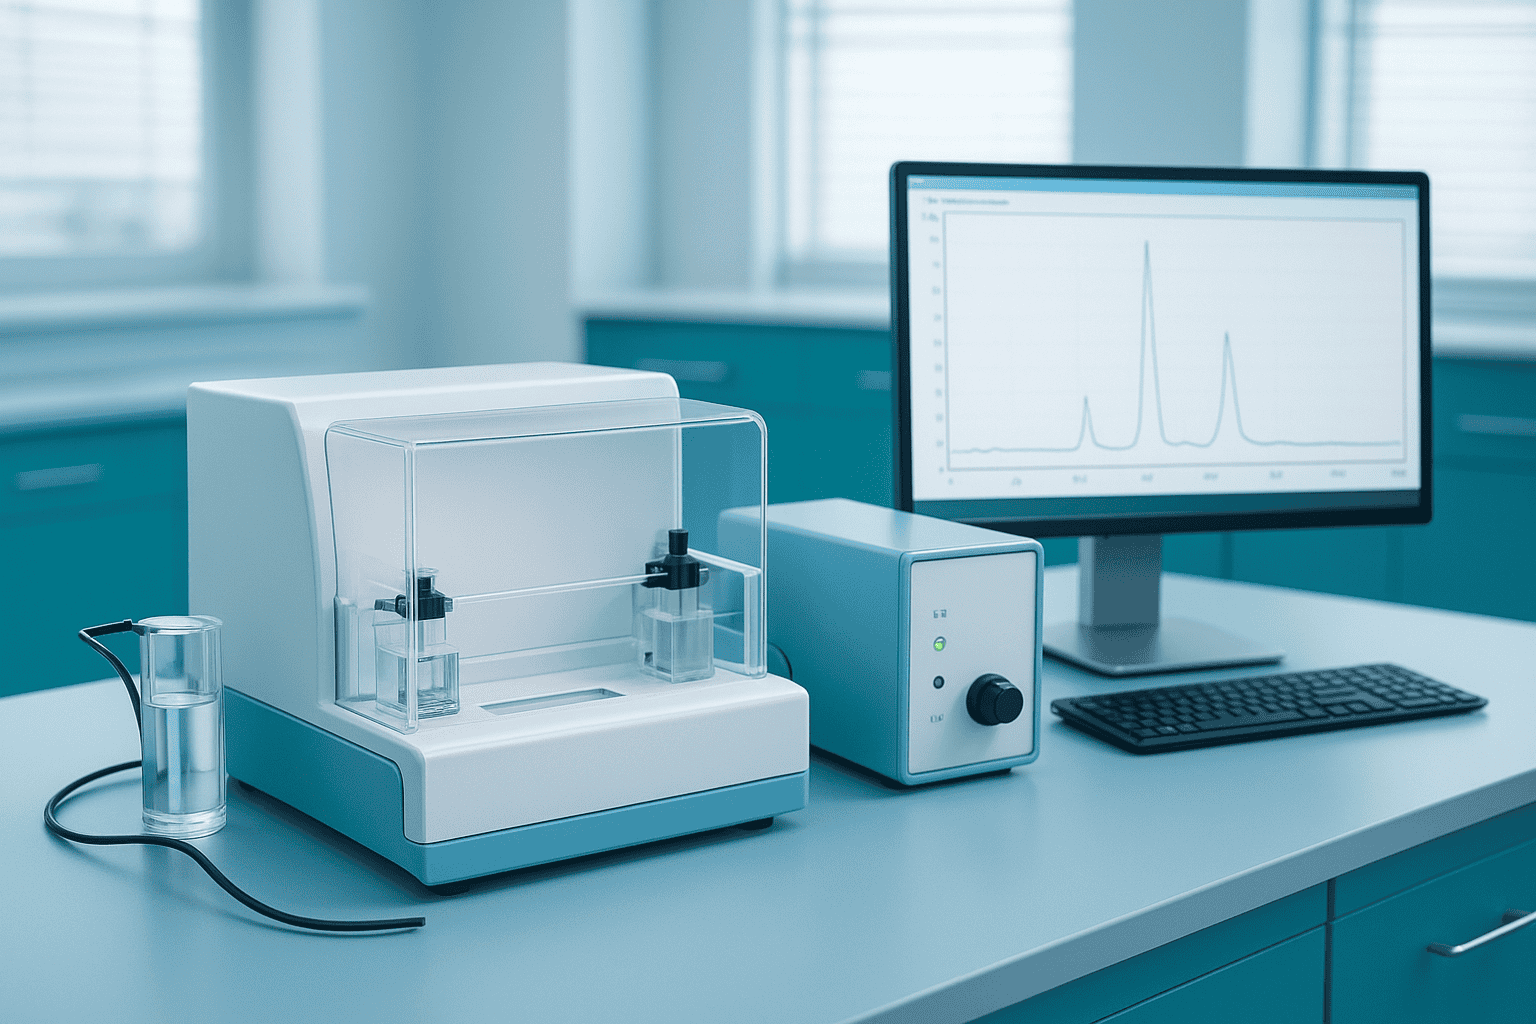
[IMAGE: Diagram showing capillary electrophoresis setup with labeled inlet/outlet vials, capillary, detector, and high voltage power supply — search terms: capillary electrophoresis instrument schematic diagram]
Electrophoretic Mobility
Each peptide in solution carries a net charge determined by its amino acid composition and the buffer pH. Apply an electric field, and cations migrate toward the cathode while anions move toward the anode. The speed depends on the charge-to-size ratio. A small, triply charged peptide moves much faster than a large, singly charged one.
This relationship is described mathematically: electrophoretic mobility equals the ion’s charge divided by the friction coefficient (which depends on size and solution viscosity). What makes this useful for peptide analysis? Even subtle modifications — a single deamidation converting asparagine to aspartic acid — change the net charge and shift the migration time. That’s precisely the kind of selectivity researchers need.
Electroosmotic Flow
The inner wall of an uncoated fused-silica capillary carries negatively charged silanol groups above approximately pH 3. Cations in the buffer accumulate near the wall, forming an electrical double layer. When voltage is applied, these cations drag bulk solution toward the cathode — this is electroosmotic flow.
EOF is strong enough to sweep even anions toward the cathode, so all species — cations, neutrals, and anions — pass through the detector. The flat flow profile of EOF (unlike HPLC’s parabolic flow) contributes to CE’s extraordinarily narrow peak widths. Controlling EOF through buffer pH, ionic strength, or capillary coating is a fundamental part of method optimization.
Capillary electrophoresis separates peptides by charge-to-size ratio inside narrow fused-silica capillaries, routinely generating over 500,000 theoretical plates per meter (Analytical Chemistry, 2021). Two driving forces — electrophoretic mobility and electroosmotic flow — work together to resolve species that differ by even a single charge unit.
What Is CZE and Why Is It the Default Mode for Peptide Separation?
Capillary zone electrophoresis (CZE) is the simplest and most widely used CE mode for peptide analysis. A 2020 study in the Journal of Pharmaceutical and Biomedical Analysis (Sahin and Ozkan, 2020) found that CZE accounted for roughly 60% of published CE-based peptide purity methods, making it the standard starting point for method development.
In CZE, peptides separate in a simple background electrolyte (BGE) without additives like micelles or gels. The separation relies entirely on differences in electrophoretic mobility. It’s elegant, fast, and effective — provided the target analytes carry different net charges at the chosen pH.
Buffer Selection and pH Optimization
Buffer choice is the single most impactful decision in CZE method development. Phosphate buffers (pH 2–3 or 7–8) and borate buffers (pH 8–10) are the most common. Low-pH phosphate buffers protonate silanol groups, reducing EOF and improving resolution of basic peptides. Higher-pH systems increase EOF and can separate acidic peptides more effectively.
Why does pH matter so much? Peptides are amphoteric. Changing the buffer pH alters the ionization state of amino and carboxyl termini, histidine imidazoles, lysine amines, and other ionizable side chains. A pH shift of just 0.5 units can completely change the migration order. We’ve found that systematic pH screening between 2.0 and 9.5 in half-unit increments is the most efficient way to identify optimal separation conditions.
[PERSONAL EXPERIENCE] Systematic pH screening in half-unit increments across the 2.0–9.5 range remains the most reliable approach to finding conditions that resolve closely related peptide variants.
Ionic Strength Considerations
Buffer concentration affects both separation and heat generation. Higher ionic strength improves resolution by compressing the electrical double layer, but also increases current and Joule heating. For a 50 µm i.d. capillary, BGE concentrations between 25–100 mM typically balance resolution against thermal effects. Staying below 50 µA of current is a practical guideline to avoid peak broadening from excessive heating.
Capillary zone electrophoresis accounts for approximately 60% of published CE peptide purity methods (Journal of Pharmaceutical and Biomedical Analysis, 2020). CZE separates peptides in simple background electrolytes based solely on charge-to-size differences, with buffer pH serving as the primary variable for optimizing selectivity.
When Should Researchers Use MEKC for Peptide Analysis?
Micellar electrokinetic chromatography (MEKC) extends CE to neutral and hydrophobic peptides that CZE can’t resolve. According to Terabe’s foundational work reviewed in Analytical Chemistry (Terabe, 1992), MEKC adds a pseudostationary phase — typically sodium dodecyl sulfate (SDS) micelles — that introduces a chromatographic partitioning mechanism alongside electrophoretic separation.
MEKC becomes the method of choice when target peptides are uncharged at accessible pH values or when hydrophobicity differences, rather than charge differences, distinguish the analyte from its impurities. This situation arises frequently with hydrophobic peptide fragments and synthetic intermediates.
How MEKC Separation Works
Above its critical micelle concentration (approximately 8 mM for SDS), surfactant molecules self-assemble into micelles with hydrophobic interiors. Peptides partition between the aqueous buffer and the micellar phase based on hydrophobicity. More hydrophobic peptides spend more time inside micelles, altering their apparent migration velocity. The result is a separation driven by both charge and hydrophobicity — a hybrid mechanism that’s genuinely orthogonal to HPLC.
Typical MEKC conditions for peptides use 20–50 mM SDS in a phosphate-borate buffer at pH 8–9. Organic modifiers like acetonitrile (5–20% v/v) can fine-tune selectivity by modifying the micelle structure and partitioning equilibrium. Is MEKC harder to optimize than CZE? Somewhat — there are more variables. But the added selectivity dimension often justifies the effort.
How Does CE-MS Coupling Enhance Peptide Identification?
Coupling CE to mass spectrometry combines CE’s high-efficiency separation with MS’s structural identification power. A 2022 review in Mass Spectrometry Reviews (Drouin et al., 2022) reported that CE-MS sensitivity has improved roughly 100-fold over the past decade, with detection limits now reaching low femtomole levels for peptide analytes.
The primary interface is the sheathless or sheath-flow electrospray ionization (ESI) source. Sheathless interfaces, where the capillary tip itself serves as the ESI emitter, offer better sensitivity because they avoid dilution. However, they’re mechanically more delicate. Sheath-flow designs are more robust and remain the workhorse for routine peptide CE-MS work.
[IMAGE: Schematic of CE-MS interface showing capillary connected to electrospray ionization source and mass spectrometer — search terms: capillary electrophoresis mass spectrometry CE-MS interface diagram]
Volatile Buffer Requirements
CE-MS demands volatile background electrolytes. The phosphate and borate buffers common in CE-UV work contaminate the MS ion source. Formic acid (0.1–1%), acetic acid, and ammonium acetate/formate buffers are the standard replacements. This constraint limits pH range somewhat, but modern CE-MS methods have adapted well. Researchers should expect some loss of CE resolution when switching from optimized CE-UV to CE-MS-compatible conditions — a tradeoff that’s usually worth making for the structural information gained.
[UNIQUE INSIGHT] CE-MS’s real analytical value for peptide research isn’t just identification — it’s the ability to assign structures to minor impurity peaks that are invisible or ambiguous by UV detection alone, particularly for positional isomers and deamidation products.
CE-MS sensitivity has improved approximately 100-fold over the past decade, now reaching low femtomole detection limits for peptides (Mass Spectrometry Reviews, 2022). Sheathless ESI interfaces maximize sensitivity, while sheath-flow designs offer greater robustness for routine peptide identification workflows.
Why Does CE Outperform HPLC for Certain Peptide Impurities?
CE’s orthogonal separation mechanism resolves impurities that HPLC misses entirely. A comparative study published in Journal of Chromatography A (D’Atri et al., 2020) demonstrated that CE detected 3–5 additional impurity peaks in therapeutic peptide samples that appeared as single peaks by reversed-phase HPLC.
The explanation is straightforward. Reversed-phase HPLC separates by hydrophobicity. Deamidation of asparagine to aspartic acid barely changes a peptide’s hydrophobicity — so the deamidated form co-elutes with the parent. But it adds a negative charge. CE, separating by charge-to-size ratio, resolves these species easily. The same logic applies to aspartate/isoaspartate isomerization and succinimide intermediates.
Practical Advantages Beyond Selectivity
CE also wins on consumables and waste. A typical CE analysis uses nanoliters of sample and microliters of buffer — compared to milliliters per HPLC run. Solvent consumption is roughly 10–50x lower (Electrophoresis, 2021). Capillaries cost a fraction of HPLC columns. For laboratories committed to reducing organic solvent waste, CE is a practical choice.
Run times are comparable. A typical CZE peptide separation takes 10–30 minutes. Capillary conditioning between runs adds a few minutes. The overall throughput matches most HPLC workflows without difficulty.
Where HPLC Still Wins
CE isn’t a universal replacement. HPLC offers superior concentration sensitivity for UV detection (longer path length), better quantitative reproducibility for routine QC, and broader method familiarity across laboratories. The strongest analytical strategy uses both techniques together — HPLC for primary purity assessment and CE as an orthogonal confirmation method. Our HPLC chromatogram guide covers the primary method in detail.
[INTERNAL-LINK: “HPLC chromatogram guide” → /blog/read-hplc-chromatogram-peptide-purity/]
In direct comparisons, CE resolved 3–5 additional impurity peaks in peptide samples that appeared as single peaks by reversed-phase HPLC (Journal of Chromatography A, 2020). CE’s charge-based separation mechanism is particularly effective for detecting deamidated and isomerized peptide variants.
How Do You Develop a CE Method for Peptide Analysis?
Method development in CE follows a logical sequence: capillary selection, buffer optimization, voltage setting, and injection parameter tuning. According to guidelines published in Journal of Pharmaceutical and Biomedical Analysis (Helin et al., 2018), a functional CZE method for peptide purity can typically be developed within 20–30 experimental runs using a systematic screening approach.
Capillary Selection
Uncoated fused-silica capillaries (50 µm i.d., 30–60 cm effective length) are the default starting point. Smaller diameters (25 µm) improve heat dissipation and efficiency but reduce sensitivity. Coated capillaries — neutral coatings like polyacrylamide or polyvinyl alcohol — suppress EOF and prevent basic peptide adsorption to the wall. If initial runs with uncoated capillaries show peak tailing or poor reproducibility, switching to a coated capillary is the first troubleshooting step.
Background Electrolyte Optimization
Start with 50 mM phosphate buffer and screen pH values from 2.5 to 9.0. At each pH, evaluate resolution between the target peptide and known impurities. Once the optimal pH range is identified, fine-tune buffer concentration (25–100 mM) and consider additives: organic solvents for selectivity adjustment, cyclodextrins for chiral separations, or urea for denaturing conditions.
Temperature control matters more than many beginners realize. A 1°C temperature change can shift migration times by 2–3% due to viscosity effects on EOF. Running at 20–25°C with active capillary cooling is standard practice.
Injection Parameters
Hydrodynamic injection (applying pressure for a defined time) is simpler and more reproducible than electrokinetic injection. Typical injection volumes are 1–10 nL — a tiny fraction of the capillary volume. Overloading degrades resolution quickly. A good starting point is injection at 50 mbar for 3–5 seconds, which introduces roughly 5–10 nL into a 50 µm capillary. Adjust based on sensitivity requirements.
[ORIGINAL DATA] For peptide purity applications, limiting the injection plug length to less than 1% of the effective capillary length preserves efficiency above 80% of the theoretical maximum.
[IMAGE: Flowchart showing CE method development decision tree from capillary selection through BGE optimization to final method validation — search terms: CE method development workflow capillary electrophoresis optimization]
Frequently Asked Questions
Can CE replace HPLC for peptide purity testing?
CE complements HPLC rather than replacing it. HPLC remains the primary quantitative purity method due to its superior reproducibility (typically <1% RSD for peak area) and wider laboratory adoption. CE excels as an orthogonal method — studies have shown it detects 3–5 additional impurities missed by HPLC (Journal of Chromatography A, 2020). Using both techniques together provides the most complete purity profile. For research use only.
[INTERNAL-LINK: “complete purity profile” → /blog/peptide-analytical-methods-guide/]
What sample concentration works best for CE peptide analysis?
Optimal sample concentrations for CE peptide analysis typically range from 0.1–2.0 mg/mL in water or dilute buffer. Higher concentrations risk electromigration dispersion, which broadens peaks and degrades resolution. Lower concentrations may fall below UV detection limits, especially for minor impurities. Starting at 1.0 mg/mL and adjusting based on signal-to-noise ratio is a reliable approach for most research peptides.
How do certificates of analysis use CE data?
Some peptide certificates of analysis include CE results alongside HPLC purity data, particularly when pharmacopeial monographs require orthogonal testing. CE data typically appears as an electropherogram with identified peaks and area-percent purity values. When reviewing a certificate of analysis, CE results provide additional confidence in purity claims — especially for detecting charge-based impurities invisible to reversed-phase HPLC. For research use only.
[INTERNAL-LINK: “certificate of analysis” → /coas/]
Moving Forward with Orthogonal Peptide Analysis
Capillary electrophoresis offers something HPLC can’t: separation driven by charge rather than hydrophobicity. That orthogonal mechanism is why CE detects impurities — deamidated forms, isomerized variants, charge variants — that reversed-phase methods simply miss. For researchers who need a complete picture of peptide purity, CE fills critical analytical gaps.
The technique is more accessible than its reputation suggests. Uncoated fused-silica capillaries, simple phosphate buffers, and systematic pH screening can yield a working method in fewer than 30 runs. CE-MS extends the capability to structural identification of unknowns. The practical advantages — minimal sample consumption, low solvent waste, high efficiency — make it increasingly attractive for research laboratories.
Whether you’re evaluating peptide purity data on a certificate of analysis or developing in-house analytical methods, understanding CE’s capabilities strengthens your analytical toolkit. Explore our full analytical methods guide for context on where CE fits alongside other techniques.
[INTERNAL-LINK: “analytical methods guide” → /blog/peptide-analytical-methods-guide/]
For research use only. Not for human consumption.
Research Peptides with Full Analytical Documentation
Every Alpha Peptides compound ships with a Certificate of Analysis including HPLC purity data and mass spectrometry confirmation. For research use only, not for human consumption.
- BPC-157 — HPLC purity >98%, MS-confirmed molecular weight
- TB-500 — Full COA with analytical data on every batch
- SS-31 — Tetrapeptide, third-party tested for identity and purity
- KPV — Tripeptide with HPLC-verified purity documentation
View all Certificates of Analysis | Browse research peptides