· For research use only. Not for human consumption.
GLP-3 dose-response data is one of the most frequently asked-about topics among researchers following this triple agonist compound. Dose-response is a fundamental concept in any field of research — it answers the question, “When you give more of a compound, does the measured effect increase proportionally?” Published clinical studies have examined GLP-3 across multiple amounts, and the data tells an interesting story.
This article explains what dose-response means in plain language, summarizes what published studies have reported about GLP-3’s dose-response patterns, and explains why this kind of data matters for research design. This is strictly a summary of published findings — no recommendations of any kind are made here.
For a beginner-friendly introduction to GLP-3, start with our GLP-3 beginner’s guide. To understand the three receptors GLP-3 targets, see our posts on the GIP receptor and glucagon receptor research.
[INTERNAL-LINK: “GLP-3 beginner’s guide” -> /blog/what-is-glp-3-beginners-guide/]
[INTERNAL-LINK: “GIP receptor” -> /blog/gip-receptor-explained-glp-3/]
[INTERNAL-LINK: “glucagon receptor research” -> /blog/glucagon-receptor-peptide-research/]
TL;DR: GLP-3 dose-response data from published clinical studies shows that measured effects generally increased with higher amounts of the compound, following a pattern common to many research peptides. Rosenstock et al. (2023) reported phase 2 data across multiple cohorts (PMID: 37385280), and Urva et al. (2022) documented phase 1b multiple-ascending data (PMID: 36354040). This article summarizes published findings only. For research use only. Not for human consumption.
What Is Dose-Response? A Simple Explanation
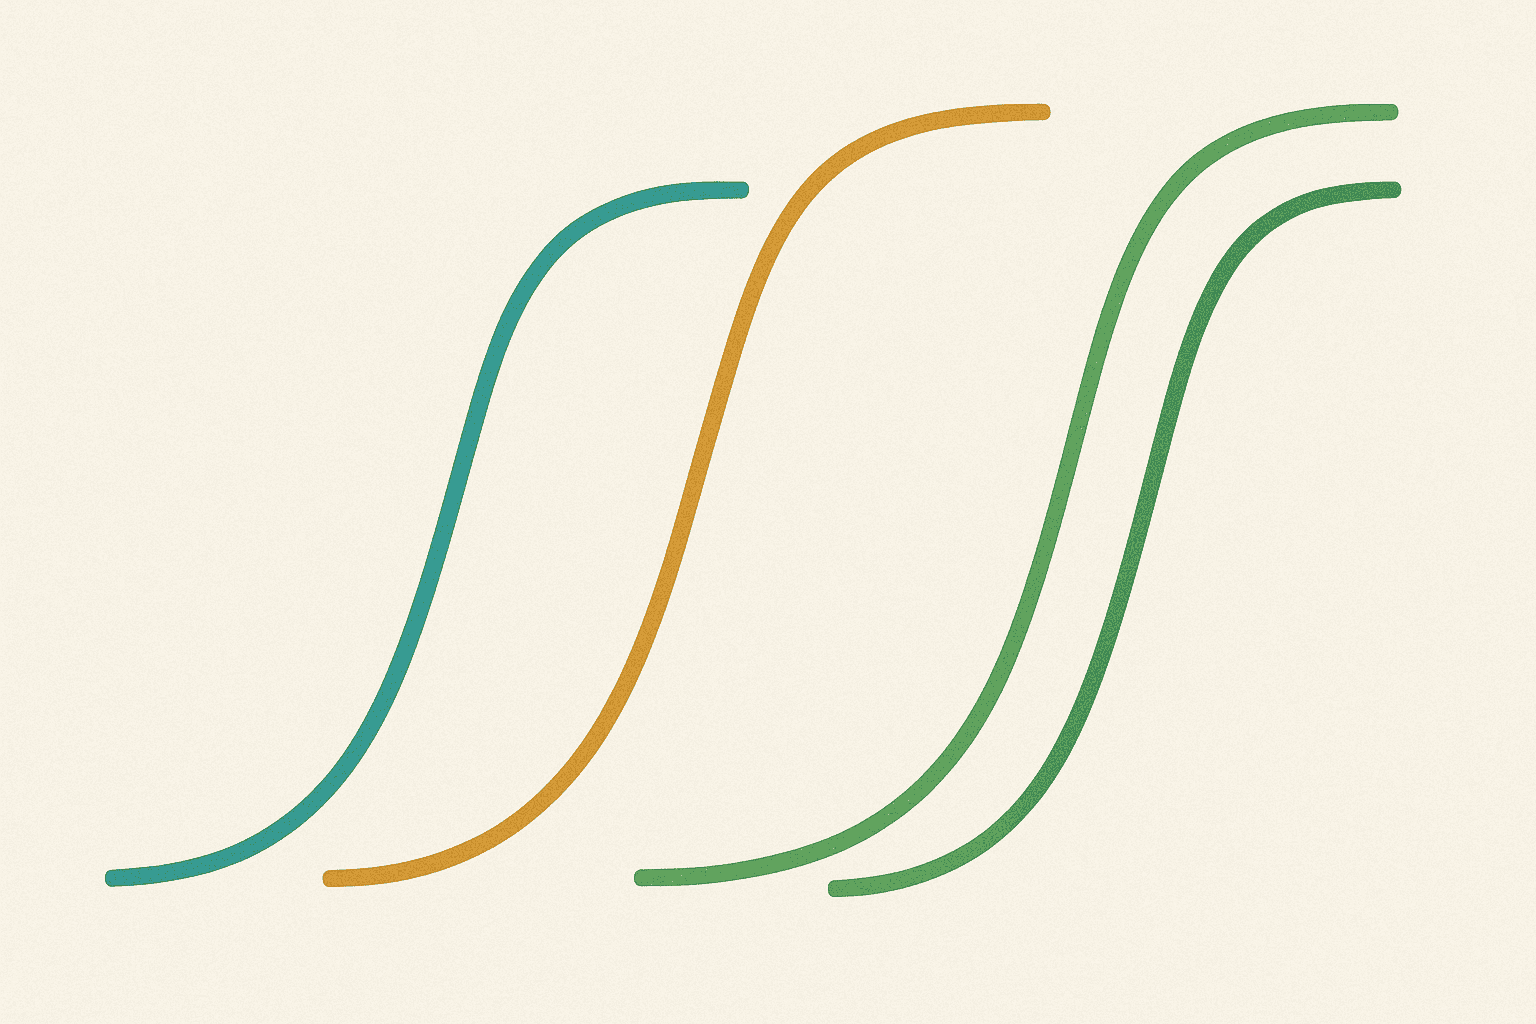
Dose-response is one of the most basic concepts in research, and it’s easy to understand once you see the pattern. Imagine you’re adjusting the volume knob on a speaker. At first, turning it up makes the sound louder proportionally. But eventually, the speaker reaches its maximum output — turning the knob further doesn’t make it any louder. That’s essentially a dose-response curve.
In research, scientists measure what happens when they give different amounts of a compound. They plot these results on a graph with the amount on one axis and the measured effect on the other. The resulting curve typically has an S-shape: a slow start, a steep middle section where the effect increases rapidly, and a plateau where more compound doesn’t produce more effect.
This pattern exists because biological systems have a limited number of receptors. Once all the receptors are occupied, adding more compound has nowhere to bind. The volume knob has reached its maximum.
GLP-3 dose-response data follows these general principles, but with its own specific characteristics because it interacts with three different receptor types simultaneously.
What Published GLP-3 Dose-Response Data Shows

Two major published studies have reported GLP-3 dose-response data: the phase 1b trial by Urva et al. (2022) and the phase 2 trial by Rosenstock et al. (2023). Both studies examined the triple agonist compound across multiple ascending amounts in controlled research settings.
The phase 1b study by Urva and colleagues was a multiple-ascending design, meaning researchers started with lower amounts and systematically increased them in different groups. This is standard research methodology — it allows scientists to observe how the compound’s measurable effects change as the amount increases. The study was multicentre, double-blind, and placebo-controlled, which are hallmarks of rigorous research design.
The phase 2 study by Rosenstock and colleagues expanded on this data, examining the compound in a larger group across additional cohorts. This study provided a broader dataset showing how GLP-3’s measured parameters varied across different amounts over a longer observation period.
Both studies reported that the measured effects of the compound generally increased with higher amounts, consistent with typical dose-response pharmacology. The relationship was not perfectly linear — as expected, the rate of increase varied across different measurement parameters.
Urva S et al. (2022) conducted a multicentre, double-blind, placebo-controlled, randomised phase 1b trial examining GLP-3 as a triple GIP, GLP-1, and glucagon receptor agonist. The study employed a multiple-ascending approach to characterize the compound’s dose-response profile across several measurement parameters. (PMID: 36354040)
Phase 1b and Phase 2 Data Patterns
Understanding the difference between phase 1b and phase 2 studies helps put the GLP-3 dose-response data in context.
A phase 1b study is typically one of the first times a compound is systematically examined in a controlled setting with multiple ascending amounts. The primary goal is characterization — understanding how the compound behaves at different levels, what its safety profile looks like, and whether the dose-response relationship is predictable. Urva et al.’s 2022 study served this purpose for GLP-3.
A phase 2 study takes the information from phase 1b and expands it. The group sizes are larger, the observation periods are longer, and the study design allows for more detailed analysis of how different amounts relate to different measured outcomes. Rosenstock et al.’s 2023 study provided this expanded dataset.
The pattern across both studies was consistent: measured parameters showed an amount-dependent relationship, meaning higher amounts were associated with greater measured effects. This is what researchers expect from a compound that is actively engaging its target receptors — it confirms that the compound is interacting with biological systems in a systematic, predictable way.
Why GLP-3 Dose-Response Data Matters for Research

Dose-response data isn’t just an academic exercise. For researchers, it provides critical information for designing future studies. Without knowing how a compound’s effects scale with amount, scientists cannot plan experiments effectively.
First, dose-response data helps researchers identify the range where the compound is most active. This is the steep part of the S-curve — where small changes in amount produce meaningful changes in measured effects. Working within this range gives researchers the most informative data from their experiments.
Second, it reveals the plateau. Knowing where additional compound stops producing additional effect is just as important as knowing where it’s most active. The plateau tells researchers the system’s ceiling — the maximum response achievable through this particular receptor pathway.
Third, dose-response data from multi-receptor compounds like GLP-3 is particularly interesting because the three receptor systems (GLP-1, GIP, and glucagon) may have different dose-response characteristics. The published data allows researchers to examine whether all three pathways respond proportionally or whether some are activated at lower amounts than others.
What Remains Under Investigation

Published GLP-3 dose-response data represents early-phase research. While the studies by Urva et al. and Rosenstock et al. provided foundational datasets, many questions remain under active investigation in the scientific community.
One open question is how the dose-response relationship changes over extended periods. Early-phase studies typically involve shorter observation windows. Whether the compound’s dose-response profile shifts, stabilizes, or changes with longer exposure is an area of ongoing research interest.
Another question involves the interaction between the three receptor pathways. GLP-3 simultaneously activates GLP-1, GIP, and glucagon receptors, and each pathway may have its own dose-response characteristics. Understanding how these three curves overlap and interact is a complex research challenge that published data has only begun to address.
This article strictly summarizes what has been reported in published, peer-reviewed studies. No recommendations of any kind are made. GLP-3 is a research compound that is under active scientific investigation, and the dose-response data described here represents the current published evidence base.
Rosenstock J et al. (2023) reported phase 2 data on GLP-3 as a GIP, GLP-1, and glucagon receptor agonist in a randomized, double-blind, placebo-controlled trial. The study examined multiple cohorts and provided dose-response data across several measurement parameters over an extended observation period. (PMID: 37385280)
Alpha Peptides offers research-grade GLP-3 RT with independent third-party testing and a Certificate of Analysis included with every order. For researchers investigating triple agonist pharmacology, multi-receptor signaling, or dose-response characterization, GLP-3 RT is one of the most actively studied compounds in the field. Browse our full catalog on the research peptides shop page, or review testing documentation on our Certificates of Analysis page.
Frequently Asked Questions
What is dose-response in research?
Dose-response describes the relationship between the amount of a compound administered and the magnitude of the measured effect. In general, increasing the amount produces increasing effects up to a plateau where the biological system’s receptors are saturated.
What did published studies find about GLP-3 dose-response?
Published phase 1b (Urva et al., 2022) and phase 2 (Rosenstock et al., 2023) studies reported that GLP-3’s measured effects generally increased with higher amounts, consistent with typical dose-response pharmacology for receptor-targeting compounds.
Does this article provide recommendations?
No. This article strictly summarizes published research findings. No recommendations of any kind are made. GLP-3 is a research compound sold for laboratory investigation only.
Why is dose-response data important for research?
Dose-response data helps researchers design future studies by identifying the active range, the plateau, and the relationship between amount and effect. Without this data, research experiments cannot be planned effectively.
Is GLP-3 available for research purposes?
Alpha Peptides carries research-grade GLP-3 RT for laboratory investigation purposes only. It is not sold for human consumption. A Certificate of Analysis is included with every order.
For research use only. Not for human consumption. This article is intended for informational and educational purposes. It does not constitute medical advice, and no therapeutic claims are made. No dosing recommendations are provided. Always consult published peer-reviewed literature for detailed research data.