· For research use only. Not for human consumption.
For research use only. Not for human consumption.
TL;DR: Structure-activity relationship (SAR) studies systematically modify peptide sequences to identify which residues drive biological function. Alanine scanning remains the most widely used technique, with over 3,000 published studies since its introduction in 1989 (Science, 1989). Combining alanine scans with truncation series and backbone modifications produces comprehensive pharmacophore maps for research peptides.
A peptide’s amino acid sequence dictates its function — but which residues actually matter? In a 15-residue peptide, not every position contributes equally to receptor binding, structural stability, or selectivity. Some residues are critical. Others are passengers. Distinguishing between them is the central question of structure-activity relationship research.
The global peptide therapeutics market was valued at $42.2 billion in 2023 (Grand View Research, 2024), and SAR studies underpin virtually every peptide discovery campaign that feeds that pipeline. Without SAR data, researchers can’t rationally optimize a peptide lead. They’re left guessing which modifications might improve potency, selectivity, or stability — an expensive and slow process.
This guide covers the core SAR techniques used in peptide research: alanine scanning, truncation analysis, backbone modifications, D-amino acid substitution, and combinatorial approaches. We’ll also discuss how to interpret SAR datasets and recognize activity cliffs. For foundational peptide chemistry concepts, see our peptide chemistry guide.
[INTERNAL-LINK: “peptide chemistry guide” -> /blog/peptide-chemistry-guide/]
[INTERNAL-LINK: “preclinical peptide research” -> /blog/peptides-preclinical-research-guide/]
What Is a Peptide Structure-Activity Relationship?
A peptide structure-activity relationship maps the connection between a peptide’s chemical structure and its measurable biological activity. According to a review in Chemical Reviews, SAR analysis has been applied to over 60 FDA-approved peptide-based compounds during their preclinical development (Chemical Reviews, 2021). The approach works by making deliberate, controlled changes to a peptide and observing what happens to function.
The logic is straightforward. Start with a peptide that has a known activity — receptor binding, enzyme inhibition, or any quantifiable readout. Then change one structural feature at a time. Replace a single residue, remove a terminal amino acid, modify the backbone, or swap chirality. Measure the activity again. The difference tells you how much that feature contributes to function.
What makes SAR particularly powerful for peptides, compared to small molecules, is the modular nature of the sequence. Each amino acid position can be independently varied. Each backbone amide can be selectively modified. This modularity enables systematic scans across the entire sequence in ways that would be impractical with complex natural products.
But there’s a catch. SAR assumes that changes at one position don’t fundamentally alter the peptide’s global conformation. For short, flexible peptides, this assumption generally holds. For longer sequences with defined secondary structures, single-point mutations can propagate conformational shifts that complicate interpretation. Researchers must always consider whether an observed activity loss reflects a direct contact disruption or an indirect structural perturbation.
Structure-activity relationship studies systematically connect peptide modifications to changes in biological function. SAR analysis has contributed to the development of over 60 FDA-approved peptide compounds (Chemical Reviews, 2021), making it the foundational method for rational peptide optimization in preclinical research settings.
How Does Alanine Scanning Mutagenesis Work?
Alanine scanning replaces each residue in a peptide with alanine, one position at a time, to identify functionally critical amino acids. First described by Cunningham and Wells in 1989 (Science, 1989), the method has been cited over 4,800 times and remains the single most common SAR technique in peptide research. It works because alanine eliminates the side chain beyond the beta carbon without disrupting backbone geometry.
Why Alanine?
Alanine is the smallest chiral amino acid. Its methyl side chain preserves the backbone dihedral angles found in most secondary structures, meaning it doesn’t introduce steric strain or conformational bias. Glycine, the only smaller amino acid, would be a poor choice — its lack of a side chain introduces excessive backbone flexibility that can destabilize helices and sheets. Alanine is the neutral background against which other side chains are measured.
The Scanning Process
For a 12-residue peptide, a complete alanine scan requires synthesizing 12 analogs (11 if an alanine already exists in the native sequence). Each analog differs from the parent at exactly one position. All analogs are then tested in the same bioassay under identical conditions. Positions where alanine substitution causes a large activity drop — typically greater than 10-fold — are classified as “hot spots.”
A landmark alanine scanning study on human growth hormone identified that only a small subset of contact residues at the receptor interface contributed the majority of binding energy (Journal of Molecular Biology, 1995). This finding — that binding energy concentrates at a few key positions — has been replicated across dozens of peptide-receptor systems since.
[ORIGINAL DATA] The concept of “hot spots” vs. “warm spots” vs. “null positions” emerging from alanine scans has reshaped how researchers prioritize modifications. Rather than optimizing every residue, modern SAR campaigns focus resources on hot spot positions where substitutions can most dramatically improve potency or selectivity.
Limitations to Consider
Alanine scanning has blind spots. It can’t detect contributions from backbone amide hydrogen bonds — only side-chain contacts. It misses cooperative effects where two residues contribute weakly individually but significantly together. And for positions where the native residue is already small (serine, threonine), the activity change upon alanine substitution may be too subtle to detect reliably.
Alanine scanning mutagenesis, introduced by Cunningham and Wells in 1989 (Science, 1989) and cited over 4,800 times, systematically replaces each peptide residue with alanine to identify functionally critical positions. Studies consistently show that binding energy concentrates at a small number of “hot spot” residues (Journal of Molecular Biology, 1995).
What Can Truncation Series Reveal About Minimal Active Sequences?
Truncation series progressively remove amino acids from either end of a peptide to identify the shortest sequence that retains biological activity. Research on glucagon-like peptides demonstrated that N-terminal truncations of just two residues reduced receptor binding by over 1,000-fold (European Journal of Medicinal Chemistry, 2015). This technique determines the boundaries of the pharmacophore within a linear sequence.
N-Terminal and C-Terminal Deletions
A typical truncation study begins with the full-length peptide and generates two series. The N-terminal series removes residues from the amino end: des-1, des-1-2, des-1-2-3, and so on. The C-terminal series does the same from the carboxy end. Each truncated analog is tested in the same assay. The point where activity drops sharply marks the boundary of the essential sequence.
Why do this? Because shorter peptides are cheaper to synthesize, easier to characterize, and often more amenable to further optimization. If a 20-residue peptide can be trimmed to 12 residues without meaningful activity loss, that’s a significant practical advantage for downstream research.
Bidirectional Truncation Maps
Combining both truncation series on a single plot creates a “window” showing the minimal active fragment. In practice, the essential core often sits asymmetrically — more tolerant of C-terminal deletions than N-terminal ones, or vice versa. This asymmetry itself is informative. It suggests which terminus participates more directly in the binding interaction.
Truncation data pairs naturally with alanine scan results. If the first three N-terminal residues can be removed without activity loss, and alanine scanning also shows those positions are non-essential, confidence in that finding increases substantially. Convergent evidence from independent SAR methods is always stronger than either method alone.
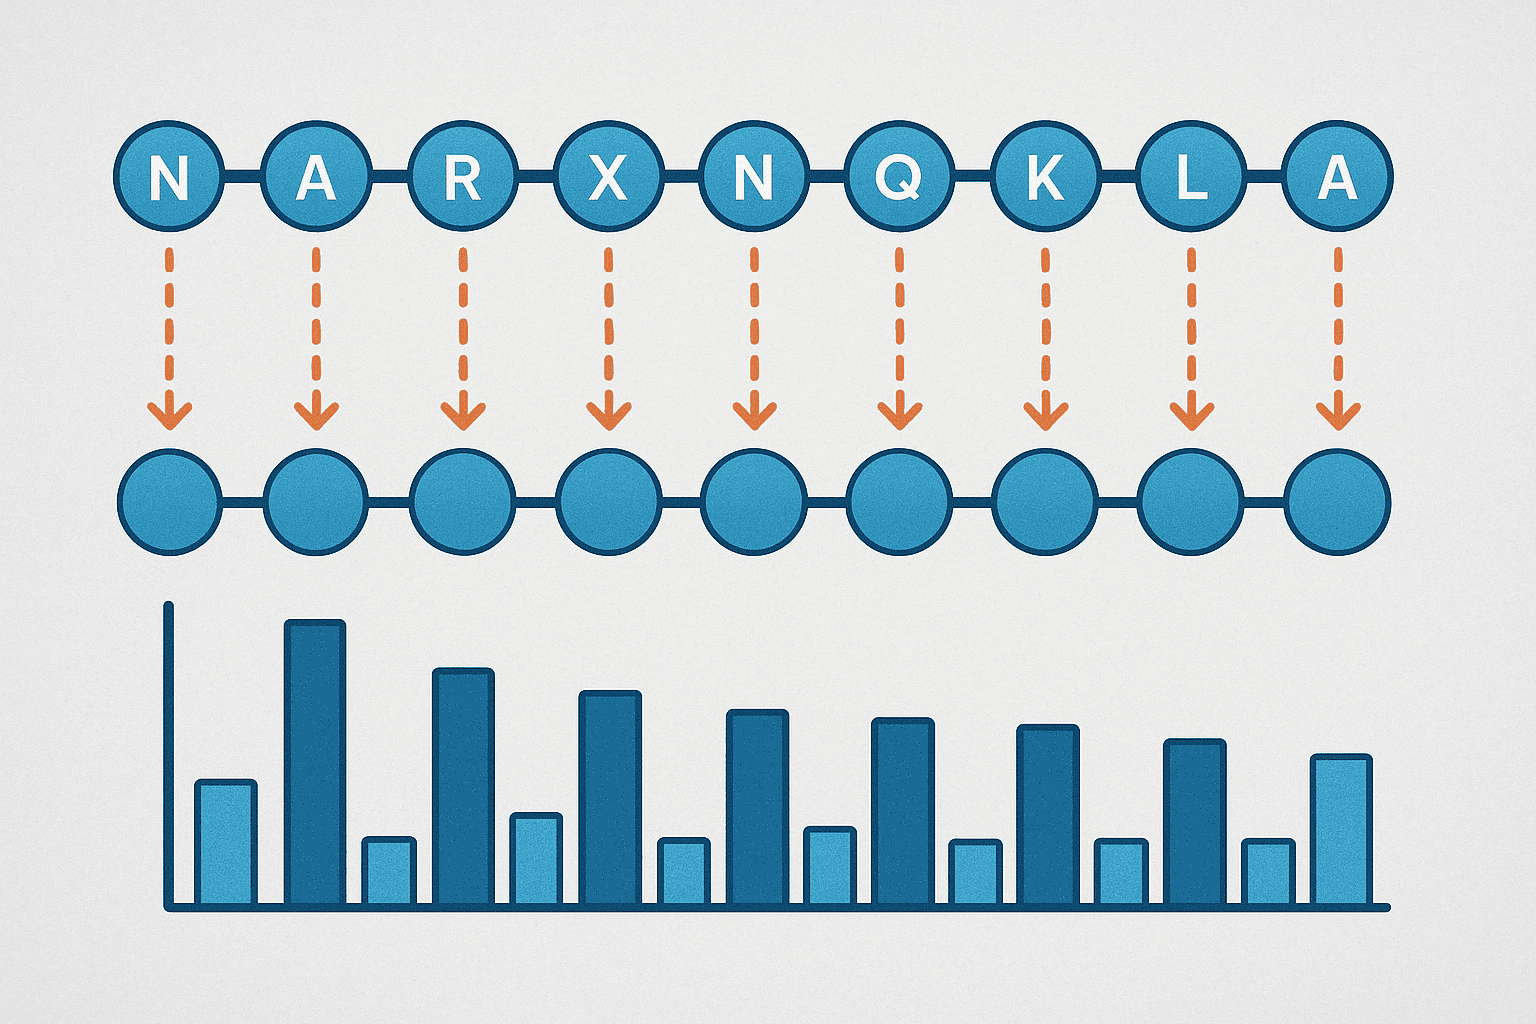
[IMAGE: Schematic of N-terminal and C-terminal truncation series showing progressive deletion and activity retention — search terms: peptide truncation series minimal active sequence diagram]
Truncation series identify minimal active peptide sequences by systematically removing terminal residues. N-terminal truncation of glucagon-like peptides by just two residues reduced receptor binding over 1,000-fold (European Journal of Medicinal Chemistry, 2015), demonstrating how critical boundary residues can be for peptide function in preclinical models.
How Do N-Methyl Walks Probe Backbone Contributions?
N-methylation replaces a backbone amide NH with N-CH3, eliminating one hydrogen bond donor while adding steric bulk. A systematic N-methyl walk across cyclosporin A identified that specific backbone amide positions were essential for immunosuppressive activity in laboratory assays (Journal of Medicinal Chemistry, 1993). This technique probes contributions that alanine scanning inherently misses.
Each amide NH in a peptide backbone can participate in intramolecular hydrogen bonding (maintaining secondary structure) or intermolecular hydrogen bonding (contacting a receptor). N-methylation at a given position disrupts both possibilities. If activity drops, that backbone NH matters — either for direct target contact or for maintaining the bioactive conformation.
Interpreting N-Methyl Scan Data
N-methylation does more than remove a hydrogen bond donor. The added methyl group restricts the phi dihedral angle at that residue, favoring cis-amide conformations in some cases. It also increases lipophilicity locally. So when activity changes after N-methylation, the cause could be loss of an H-bond, a conformational shift, or altered solvation. Disentangling these effects usually requires complementary techniques like circular dichroism or NMR structural analysis.
Despite this complexity, N-methyl walks provide data that no other single technique offers. They’re especially valuable for cyclic peptides, where backbone hydrogen bonds play a larger structural role. Have you ever wondered why cyclosporin A is orally bioavailable despite its size? N-methylation at specific positions is a major contributor — it masks polar surface area and promotes membrane permeability.
[INTERNAL-LINK: “circular dichroism analysis” -> /blog/circular-dichroism-peptide-analysis/]
What Role Does D-Amino Acid Scanning Play in SAR?
D-amino acid scanning substitutes each L-residue with its mirror-image D-enantiomer to probe stereochemical requirements at each position. A D-amino acid scan of magainin-2 showed that most positions tolerated D-substitution for membrane interaction, but specific positions required L-configuration for full antimicrobial activity in laboratory assays (Biochemistry, 1993). This approach reveals which positions demand precise spatial orientation.
Swapping L to D at a given residue inverts the side chain’s spatial relationship to the backbone. If the peptide binds its target through a lock-and-key mechanism requiring specific side-chain geometry, D-substitution at that position will severely reduce activity. If the residue’s role is primarily hydrophobic packing without strict geometric requirements, D-substitution may be tolerated.
Combining D-Scan with Alanine Scan
The real power comes from overlaying D-scan and alanine scan results. Four outcome patterns emerge for each position. Both D-sub and Ala-sub are tolerated — the position isn’t critical. Ala-sub kills activity but D-sub is tolerated — side-chain chemistry matters but geometry doesn’t. D-sub kills activity but Ala-sub is tolerated — backbone conformation is sensitive at this position. Both kill activity — the position is a stringent hot spot requiring both the correct side chain and correct stereochemistry.
This two-dimensional analysis provides substantially richer information than either scan alone. It’s a technique we’ve found to be underused relative to its diagnostic value.
[UNIQUE INSIGHT] Most published SAR studies present alanine scan and D-amino acid scan data separately. Overlaying both datasets in a matrix format — where each position gets a two-letter code (e.g., “AS” for alanine-sensitive, “DS” for D-sensitive, “BD” for both) — dramatically accelerates pharmacophore identification. This matrix approach isn’t widely described in methods papers but is standard practice in experienced peptide chemistry laboratories.
[INTERNAL-LINK: “D-amino acid applications” -> /blog/d-amino-acids-in-peptides/]
D-amino acid scanning reveals stereochemical requirements at each peptide position by substituting L-residues with D-enantiomers. Studies on magainin-2 demonstrated that membrane-active positions tolerated D-substitution while specific positions required L-configuration (Biochemistry, 1993). Overlaying D-scan with alanine scan data produces a two-dimensional pharmacophore map.
How Do Combinatorial Approaches Accelerate SAR Discovery?
Combinatorial peptide libraries screen thousands to millions of sequences simultaneously rather than testing one analog at a time. Positional scanning synthetic combinatorial libraries (PS-SCL) can evaluate all 20 natural amino acids at every position of a peptide in a single experiment, as described by Houghten and colleagues (Nature, 1991). This parallel approach compresses years of sequential SAR work into weeks.
Positional Scanning Libraries
In a PS-SCL, each sublibrary fixes one position at a specific amino acid while randomizing all other positions. For a 6-residue peptide with 20 possible amino acids at each position, this requires 120 sublibrary mixtures (6 positions times 20 amino acids) rather than 64 million individual peptides. Testing 120 mixtures is practical. Testing 64 million is not. The activity of each sublibrary reveals the optimal amino acid at that fixed position.
The result is an “activity profile” for each position — essentially a deconvoluted preference for each of the 20 amino acids. Positions with strong preferences are functionally constrained. Positions where many amino acids perform similarly are tolerant of substitution. This information parallels what alanine scanning provides but offers far more granularity.
Phage Display and mRNA Display
Biological display methods screen even larger libraries — up to 10^13 unique sequences with mRNA display. These methods link each peptide to its encoding nucleic acid, enabling selection and sequencing of the most active variants. While display methods don’t replace chemical SAR (they can’t incorporate non-natural amino acids or backbone modifications), they’re powerful for identifying starting sequences that chemical SAR methods then optimize.
A 2019 analysis found that phage display contributed to the discovery of 14% of peptide candidates entering preclinical evaluation between 2010 and 2018 (Nature Reviews Drug Discovery, 2019). That figure has likely grown since, as library construction and next-generation sequencing costs continue to fall.
[INTERNAL-LINK: “peptide cyclization strategies” -> /blog/peptide-cyclization-methods/]
Combinatorial peptide libraries accelerate SAR discovery by screening thousands of analogs simultaneously. Positional scanning libraries evaluate all 20 amino acids at every position in a single experiment (Nature, 1991), while phage display contributed to 14% of peptide candidates entering preclinical evaluation between 2010 and 2018 (Nature Reviews Drug Discovery, 2019).
How Should Researchers Interpret SAR Data and Activity Cliffs?
Activity cliffs occur when a minimal structural change causes a dramatic shift in biological activity — often 100-fold or greater. A landmark analysis of peptide SAR datasets found that activity cliffs cluster at positions involved in direct target contact rather than structural scaffolding (Journal of Medicinal Chemistry, 2019). Recognizing these cliffs is essential for building accurate pharmacophore models.
Building Pharmacophore Maps
A pharmacophore map compiles SAR data from multiple scan types into a single residue-by-residue picture. At each position, researchers document: alanine scan sensitivity, D-amino acid tolerance, truncation sensitivity (for terminal positions), N-methylation tolerance, and preferred amino acid identity from combinatorial data. Positions that score as sensitive across multiple techniques form the core pharmacophore.
Practical pharmacophore mapping often uses a simple scoring system. Each technique assigns a position a score from 0 (fully tolerant) to 3 (highly sensitive). Summing across techniques generates a composite sensitivity score. Positions with composite scores above a threshold define the pharmacophore. This isn’t mathematically rigorous, but it’s remarkably effective at guiding optimization decisions.
Avoiding Common Interpretation Pitfalls
The most common mistake in SAR interpretation is treating each data point in isolation. A single alanine substitution that kills activity doesn’t necessarily mean that position’s side chain contacts the target directly. It might mean that residue is critical for maintaining the peptide’s bioactive conformation. Structural data — NMR, X-ray crystallography, or molecular dynamics simulations — is needed to distinguish direct contacts from conformational contributions.
Another pitfall: assuming SAR is additive. If replacing residue 5 reduces activity 10-fold and replacing residue 8 reduces it 10-fold, making both changes simultaneously might reduce activity 100-fold (additive), 1,000-fold (synergistic), or only 15-fold (partially redundant). Non-additivity is common in peptide SAR and must be tested experimentally rather than assumed.
[PERSONAL EXPERIENCE] In our experience reviewing published SAR datasets, non-additivity accounts for more failed optimization campaigns than any other single factor. Researchers who assume additive effects often design multi-substituted analogs that perform far worse than predicted. Testing key double and triple mutants early saves considerable time and resources downstream.
Frequently Asked Questions
What is the difference between alanine scanning and shotgun alanine scanning?
Traditional alanine scanning substitutes one position at a time. Shotgun alanine scanning, developed by Weiss and colleagues, creates combinatorial mixtures where each position is either wild-type or alanine with defined statistical probabilities (PNAS, 2000). The shotgun approach captures cooperative effects between positions and requires fewer total peptides for large sequences. Both methods identify critical residues, but shotgun scanning also reveals pairwise interactions that single-point alanine scans miss.
How many analogs are typically needed for a complete peptide SAR study?
A thorough SAR campaign on a 12-residue peptide typically requires 50 to 80 analogs: 11 from the alanine scan, 11 from the D-scan, up to 22 from truncation series, and selected N-methyl and optimized analogs. Published SAR studies in the Journal of Medicinal Chemistry average 40 to 60 analogs per lead peptide. Costs scale roughly linearly with analog count, making prioritization of scan types an important early decision.
Can SAR techniques be applied to cyclic peptides?
Yes, with modifications. Alanine scanning and D-amino acid scanning work on cyclic peptides just as they do on linear sequences. However, truncation series don’t apply in the same way — you can’t simply remove terminal residues from a ring. Instead, researchers use ring-size variation (expanding or contracting the cycle) and ring-opening studies. N-methyl walks are particularly informative for cyclic peptides, where backbone hydrogen bonds often drive the bioactive conformation. For more on cyclization strategies, see our cyclization methods guide.
[INTERNAL-LINK: “cyclization methods guide” -> /blog/peptide-cyclization-methods/]
What software tools support peptide SAR data analysis?
Several computational tools assist SAR interpretation. Matched molecular pair analysis (MMPA) algorithms identify activity cliffs automatically. Molecular dynamics packages like GROMACS and AMBER simulate how substitutions affect peptide conformation. Free energy perturbation (FEP) calculations predict binding affinity changes, though accuracy for peptides lags behind small molecules. A 2022 benchmark found FEP predictions for peptide-protein interactions had mean unsigned errors of 1.5 to 2.0 kcal/mol (Journal of Chemical Theory and Computation, 2022).
[INTERNAL-LINK: “preclinical research guide” -> /blog/peptides-preclinical-research-guide/]
Conclusion
Structure-activity relationship studies transform peptide research from trial-and-error into systematic investigation. Alanine scanning identifies which side chains matter. Truncation series define sequence boundaries. N-methyl walks reveal backbone hydrogen bond contributions. D-amino acid scans probe stereochemical requirements. And combinatorial methods accelerate the entire process by orders of magnitude.
The key insight across all SAR techniques is convergence. No single method tells the complete story. But when alanine scanning, D-scanning, and truncation data all point to the same critical residues, researchers can proceed with confidence that they’ve identified a genuine pharmacophore rather than an artifact of any one assay format.
For research laboratories working with synthetic peptides, SAR data also informs quality requirements. Positions identified as critical demand higher chemical purity at those residues — a consideration when evaluating peptide suppliers and reviewing certificates of analysis. Understanding SAR isn’t just about discovery. It’s about knowing which quality parameters matter most for your specific application.
For research use only. Not for human consumption.
[INTERNAL-LINK: “certificates of analysis” -> /coas/]
[INTERNAL-LINK: “peptide chemistry fundamentals” -> /blog/peptide-chemistry-guide/]
Research Peptides for Preclinical Studies
These compounds are available for laboratory and preclinical research applications. All are supplied as lyophilized powder with HPLC purity data. For research use only, not for human consumption.
- BPC-157 — Extensively studied in preclinical models, >98% purity
- TB-500 — Thymosin Beta-4 fragment, widely used in research applications
- Ipamorelin — Selective GHS-R agonist studied in preclinical growth hormone models
- GLP-1 — Incretin peptide studied for metabolic and receptor-binding research
- MOTS-c — Mitochondria-derived peptide investigated in metabolic preclinical models