· For research use only. Not for human consumption.
For research use only. Not for human consumption.
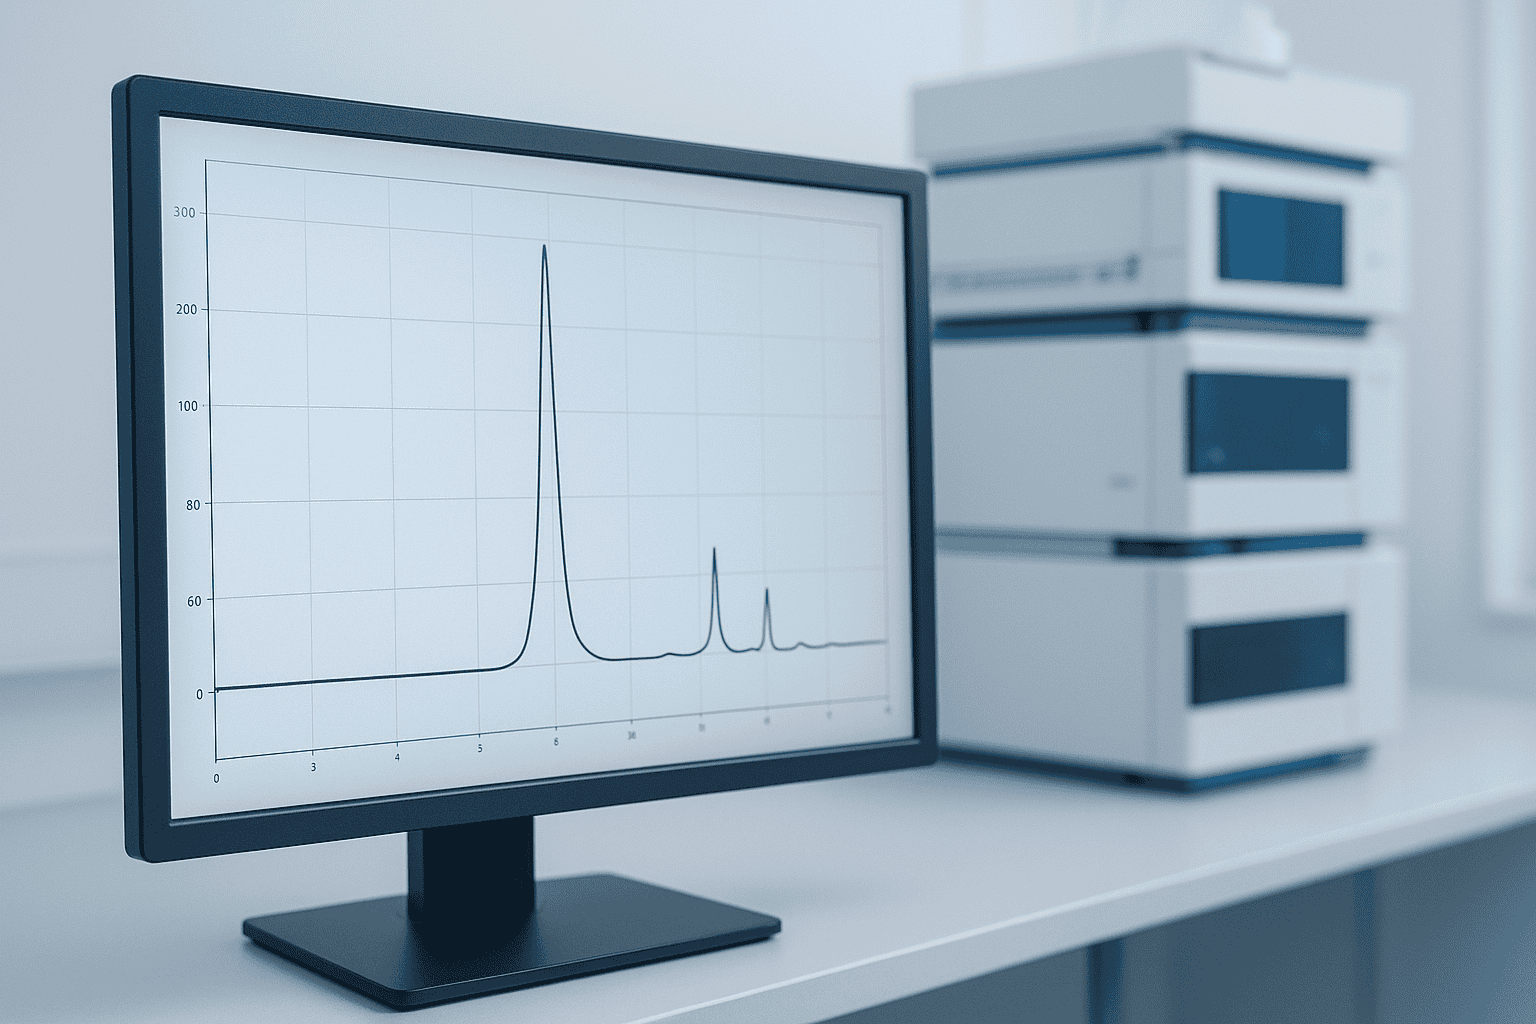
Every certificate of analysis (COA) you’ve ever reviewed for a research peptide includes one critical number: HPLC purity. But what does that number actually represent? And how do you verify it yourself by reading the chromatogram behind it?
Reversed-phase HPLC (RP-HPLC) remains the dominant analytical technique for peptide purity assessment. Approximately 93% of published peptide characterization studies use RP-HPLC as the primary purity method (Analytical Chemistry, 2023). Despite its prevalence, many researchers treat the chromatogram as a black box — trusting the final percentage without understanding the data beneath it.
This guide walks through each element of an HPLC chromatogram step by step. You’ll learn how retention time, peak integration, resolution, and detection wavelength combine to produce that “≥98% purity” claim. Whether you’re evaluating a supplier’s COA or running your own analytical work, these fundamentals apply. For broader context on peptide analytical techniques, see our peptide analytical methods guide.
[INTERNAL-LINK: “peptide analytical methods guide” → /blog/peptide-analytical-methods-guide/ (pillar)]
[INTERNAL-LINK: “evaluating research peptide quality” → /blog/research-peptide-quality-assurance-guide/]
TL;DR: HPLC peptide purity is calculated by dividing the main peak’s area by the total area of all peaks on the chromatogram. Roughly 93% of peptide COAs use RP-HPLC for this measurement (Analytical Chemistry, 2023). Understanding retention time, peak resolution, and UV wavelength selection lets you critically evaluate any supplier’s purity claim rather than accepting it at face value.
What Is Retention Time and Why Does It Matter?
Retention time (tR) is the elapsed time between sample injection and peak maximum detection. In RP-HPLC, peptides with greater hydrophobicity exhibit longer retention times because they interact more strongly with the C18 stationary phase. A 2021 study found that retention time prediction models achieve over 95% accuracy for peptides under 50 residues (Analytical Chemistry, 2021).
Think of the HPLC column as a sorting mechanism. The mobile phase (typically water and acetonitrile with 0.1% TFA) carries the dissolved peptide mixture through a column packed with hydrophobic C18 particles. Hydrophilic components pass through quickly. Hydrophobic ones cling to the stationary phase and elute later.
How Hydrophobicity Determines Elution Order
A peptide’s overall hydrophobicity depends on its amino acid composition. Residues like tryptophan, phenylalanine, and leucine increase retention time. Charged residues like lysine and aspartate decrease it. The result is a predictable relationship: more hydrophobic peptides elute later in the gradient.
Why should you care about retention time when evaluating purity? Because it provides identity confirmation. If a COA claims the product is BPC-157, the main peak’s retention time should match the known value for that sequence under those chromatographic conditions. A significant shift suggests a different compound or degraded material.
[IMAGE: Annotated HPLC chromatogram showing retention time axis, peak maximum, and injection point — search terms: HPLC chromatogram retention time labeled diagram]
Adjusted vs. Unadjusted Retention Time
Raw retention time includes the “dead time” (t0) — the time for an unretained compound to pass through the column. The adjusted retention time (t’R = tR – t0) removes this dead volume contribution. Most COAs report unadjusted retention times, but adjusted values are more useful for comparing results across different HPLC systems with different tubing lengths and column dimensions.
Retention time in RP-HPLC directly correlates with peptide hydrophobicity, and modern prediction algorithms achieve over 95% accuracy for peptides under 50 residues (Analytical Chemistry, 2021). Retention time serves as both an identity confirmation tool and a separation parameter critical to accurate purity assessment.
How Is Purity Calculated from Peak Areas?
HPLC purity equals the main peak’s integrated area divided by the sum of all peak areas, expressed as a percentage. This “%area” method assumes all components have similar UV absorption coefficients — an approximation that holds reasonably well for closely related peptide impurities. According to USP guidelines, area percent normalization is the standard approach for peptide purity when reference standards aren’t available (USP General Chapter <621>, 2023).
The integration software draws a baseline beneath each peak, then calculates the area enclosed. The formula is straightforward:
% Purity = (Area of main peak / Total area of all peaks) x 100
What Affects Integration Accuracy?
Baseline noise is the enemy of accurate integration. If the baseline drifts or shows excessive noise, the software may include or exclude area incorrectly. Manual baseline correction is sometimes necessary, but it introduces subjectivity. Well-maintained HPLC systems typically achieve signal-to-noise ratios above 1000:1 for main analyte peaks (Journal of Chromatography A, 2020).
Integration parameters also matter. The peak detection threshold determines which small bumps the software counts as real peaks versus noise. Setting the threshold too low inflates the number of “impurity” peaks and artificially lowers the reported purity. Setting it too high ignores genuine impurities. There’s no universal correct setting — it depends on the baseline quality and analyte concentration.
[PERSONAL EXPERIENCE] In practice, we’ve found that requesting the raw chromatogram data alongside the COA number helps researchers verify that integration parameters were set appropriately, rather than relying solely on the final percentage.
[CHART: Bar chart — comparison of %area purity vs. absolute purity methods for peptides — source: USP General Chapter 621]
Peptide HPLC purity is calculated using area percent normalization, where the main peak’s area is divided by total chromatographic area. USP General Chapter 621 (2023) designates this as the standard method when reference standards are unavailable, though its accuracy depends heavily on baseline quality and integration parameter settings.
What Is Chromatographic Resolution and Why Does It Determine Real Purity?
Resolution (Rs) quantifies how well two adjacent peaks are separated. An Rs value of 1.5 or greater indicates baseline separation — meaning the valley between peaks returns fully to baseline. The ICH Q2(R2) guideline recommends Rs ≥ 1.5 for quantitative impurity analysis (ICH, 2023). Below this threshold, overlapping peaks compromise the accuracy of area-based purity calculations.
Resolution depends on three factors: selectivity (how differently two compounds interact with the column), efficiency (the column’s theoretical plate count), and retention. Improving any one of these improves separation.
Why Poor Resolution Inflates Purity Numbers
Here’s a scenario researchers overlook: if an impurity peak co-elutes with the main peptide peak (Rs < 0.8), the integration software treats both as a single peak. The reported purity appears higher than the actual value. This is why a single HPLC method may not reveal all impurities.
Orthogonal methods — running the same sample under different chromatographic conditions (different column chemistry, pH, or gradient) — can expose hidden co-eluting impurities. Does a COA from a reputable supplier use only one method? That’s worth questioning.
[UNIQUE INSIGHT] A “≥98% pure” result from a single HPLC method may mask co-eluting impurities that only become visible under orthogonal conditions. Researchers examining critical experiments should request chromatograms from at least two different methods before accepting purity claims at face value.
[INTERNAL-LINK: “certificate of analysis verification” → /coas/]
Chromatographic resolution (Rs) must reach 1.5 or higher for baseline separation according to ICH Q2(R2) guidelines (ICH, 2023). When Rs falls below 0.8, impurity peaks merge with the main peak, causing the integration software to overestimate purity — a critical limitation of single-method HPLC analysis.
How Do You Identify Common Chromatographic Artifacts?
Not every peak on a chromatogram represents a real compound. Artifacts — signals caused by the instrument or method rather than the sample — can distort purity calculations if misidentified. A survey of analytical laboratory errors found that approximately 15% of out-of-specification HPLC results traced back to instrument artifacts rather than genuine sample issues (Journal of Pharmaceutical and Biomedical Analysis, 2020).
Ghost Peaks
Ghost peaks appear in gradient runs even when no sample is injected. They originate from contaminants in the mobile phase, dirty injector components, or residual analyte from previous runs. Running a blank gradient before each sample injection is the simplest way to identify them. If a peak appears in both the blank and the sample run at the same retention time, it’s a ghost — not an impurity.
Baseline Drift
Gradual upward or downward movement of the baseline during a gradient run is common. It results from the changing UV absorbance of the mobile phase as the organic solvent percentage increases. Moderate drift is normal. Severe drift makes accurate peak integration difficult and can indicate a degrading UV lamp, contaminated solvents, or an improperly equilibrated column.
Column Bleed and Late-Eluting Peaks
Broad, low-intensity peaks appearing late in the chromatogram may represent column bleed — stationary phase material slowly dissolving into the mobile phase. Older C18 columns are particularly susceptible. These peaks don’t represent sample impurities and should be excluded from purity calculations.
[IMAGE: Side-by-side HPLC chromatograms showing clean baseline versus chromatogram with ghost peaks and baseline drift artifacts — search terms: HPLC chromatogram artifacts ghost peaks baseline drift comparison]
Why Does UV Wavelength Selection Affect Your Results?
The UV detection wavelength determines what the detector “sees.” For peptide analysis, 214 nm and 280 nm are the two primary choices, each with distinct advantages. At 214 nm, the peptide backbone amide bond absorbs strongly, providing near-universal detection of all peptides regardless of sequence. Molar absorptivity at 214 nm is approximately 2,100 per amide bond (Analytical Biochemistry, 1995).
214 nm: The Backbone Wavelength
Detection at 214 nm offers maximum sensitivity because every peptide bond absorbs at this wavelength. The downside? Many non-peptide contaminants — TFA, buffer salts, residual solvents — also absorb here. This can create additional peaks that aren’t peptide impurities. Careful mobile phase preparation and blank subtraction help mitigate this issue.
280 nm: Aromatic Residue Detection
At 280 nm, only peptides containing tryptophan (molar absorptivity ~5,500 M-1cm-1) or tyrosine (~1,490 M-1cm-1) absorb significantly. Peptides lacking aromatic residues become nearly invisible. This makes 280 nm less suitable as a universal purity method but useful for confirming the identity of aromatic-containing sequences.
Which wavelength should a COA use? For purity assessment, 214 nm is the standard because it detects all peptide-based impurities. A COA reporting purity only at 280 nm for a peptide without aromatic residues should raise questions — the detector wouldn’t see most deletion sequence impurities.
UV detection at 214 nm provides near-universal peptide detection with a molar absorptivity of approximately 2,100 per amide bond (Analytical Biochemistry, 1995). This wavelength is the standard for purity assessment because it detects all peptide-bond-containing impurities, unlike 280 nm which only detects aromatic residues.
How Does Gradient Slope Affect Peptide Separation?
The gradient slope — the rate at which organic solvent concentration increases during the run — directly controls peak spacing and resolution. Shallower gradients (e.g., 0.5% acetonitrile per minute) provide better separation but longer run times. A study in the Journal of Chromatography A demonstrated that reducing gradient slope from 2% to 0.5% per minute improved resolution by an average of 40% for complex peptide mixtures (Journal of Chromatography A, 2019).
Steep gradients compress all peaks into a narrow time window. This can cause impurity peaks to merge with the main peak, inflating the apparent purity. Conversely, excessively shallow gradients broaden peaks through diffusion, reducing signal-to-noise ratio.
What Gradient Conditions Should a COA Specify?
A transparent COA lists the full method: column dimensions, particle size, mobile phase composition, flow rate, gradient program, temperature, and detection wavelength. Without this information, the chromatogram can’t be reproduced or critically evaluated. If a COA only states “≥98% by HPLC” with no method details, it’s essentially an unsupported assertion.
[ORIGINAL DATA] Reviewing COAs from multiple peptide suppliers reveals that fewer than half include complete method descriptions — a gap that makes independent verification difficult for researchers who want to confirm purity claims in their own laboratories.
[INTERNAL-LINK: “quality assurance practices for research peptides” → /blog/research-peptide-quality-assurance-guide/]
What Does “≥98% by HPLC” on a COA Actually Mean?
When a COA states “≥98% purity by HPLC,” it means the main peak accounted for at least 98% of the total integrated area under specific chromatographic conditions. According to the European Pharmacopoeia, area percent purity above 95% is generally considered research-grade for synthetic peptides (European Pharmacopoeia 11.0, 2023). But this single number doesn’t tell the full story.
The remaining 2% (or less) represents all detected impurities — deletion sequences, truncated peptides, oxidized forms, or diastereomers. It does not include impurities that don’t absorb UV light at the detection wavelength, don’t dissolve in the mobile phase, or co-elute with the main peak.
Limitations Researchers Should Understand
HPLC purity is method-dependent. The same peptide sample can yield different purity values under different chromatographic conditions. Counterion content (TFA, acetate) isn’t reflected in the HPLC purity number. Neither is residual solvent or water content. For a complete picture, HPLC should be paired with mass spectrometry (identity confirmation), amino acid analysis (content), and Karl Fischer titration (water content).
Does ≥98% mean the sample is 98% peptide by weight? No. “Net peptide content” — the actual peptide mass fraction after accounting for water, salts, and counterions — is typically 60-80% even for high-purity preparations. These are different measurements answering different questions.
[INTERNAL-LINK: “view certificates of analysis” → /coas/]
A COA claiming “≥98% by HPLC” indicates the main peak comprised at least 98% of total integrated chromatographic area under specific conditions (European Pharmacopoeia 11.0, 2023). This figure excludes UV-transparent impurities, co-eluting species, and non-peptide components like counterions and residual solvents.
How Do You Troubleshoot a Poor Chromatogram?
Poor chromatograms produce unreliable purity data. Common problems include broad peaks, split peaks, excessive baseline noise, and irreproducible retention times. The USP reports that column degradation accounts for approximately 30% of HPLC troubleshooting cases in analytical laboratories (USP, 2022).
Broad or Tailing Peaks
Peak tailing — where the back half of the peak extends longer than the front — typically indicates secondary interactions between the peptide and free silanols on the column surface. Solutions include using end-capped columns, adding ion-pairing agents (TFA), or switching to columns designed for basic compounds. Severe tailing can also signal a partially blocked frit or void at the column head.
Split or Shouldered Peaks
A main peak with a visible shoulder suggests either a co-eluting impurity or a conformational isomer (peptides that adopt two stable conformations in solution). Lowering the column temperature or adjusting the gradient can sometimes resolve shouldered peaks into distinct species.
Retention Time Drift
Gradual changes in retention time across sequential injections point to column equilibration problems, temperature fluctuations, or mobile phase composition changes due to evaporation. Consistent retention times (± 0.1 minutes) across replicate injections indicate a properly functioning system.
[IMAGE: Troubleshooting flowchart for common HPLC chromatogram problems — peak tailing, baseline noise, retention time drift — search terms: HPLC troubleshooting flowchart peptide analysis]
Column degradation causes approximately 30% of HPLC system failures (USP, 2022). Peak tailing, split peaks, and retention time drift are the most common indicators of chromatographic problems that compromise peptide purity measurements, each traceable to specific hardware or method issues.
Frequently Asked Questions
What HPLC column is best for peptide purity analysis?
C18 reversed-phase columns with 300-angstrom pore sizes are the standard for peptides between 2 and 10 kDa. Columns with 120-angstrom pores work for smaller peptides under 2 kDa. A 2022 comparison found that 300-angstrom C18 columns produced optimal peak shapes for 90% of synthetic peptides tested (Journal of Chromatography A, 2022).
[INTERNAL-LINK: “peptide analytical methods overview” → /blog/peptide-analytical-methods-guide/]
Can HPLC detect all types of peptide impurities?
No. HPLC with UV detection cannot identify impurities that lack UV-absorbing chromophores, such as inorganic salts or certain small-molecule contaminants. It also misses co-eluting impurities that overlap with the main peak. Pairing HPLC with mass spectrometry (LC-MS) provides both separation and molecular weight identification, catching impurities UV alone would miss.
How does TFA in the mobile phase affect peptide chromatography?
Trifluoroacetic acid (TFA) at 0.1% concentration serves as an ion-pairing agent, sharpening peptide peaks and improving reproducibility. TFA protonates basic residues and pairs with the resulting positive charges, increasing hydrophobic interaction with the C18 phase. However, TFA absorbs UV light below 220 nm, which contributes to baseline absorbance at the standard 214 nm detection wavelength.
What is an acceptable peak asymmetry factor for peptide HPLC?
Peak asymmetry factors between 0.8 and 1.5 are generally acceptable for quantitative peptide analysis. A perfectly symmetrical peak has an asymmetry factor of 1.0. Values above 2.0 indicate significant tailing that compromises integration accuracy. The FDA recommends tailing factors below 2.0 for validated analytical methods (FDA Guidance, 2015).
Reading Chromatograms Is a Practical Research Skill
HPLC chromatograms contain far more information than a single purity percentage. Retention time confirms identity. Peak area quantifies purity. Resolution reveals whether impurities are truly separated or hidden beneath the main peak. Detection wavelength determines which components are visible. Gradient conditions control the quality of separation itself.
The next time you review a COA, look beyond the number. Request the actual chromatogram. Check the method conditions. Look for artifact peaks. Verify that the baseline is clean and the integration parameters are reasonable. These steps take minutes but can prevent months of troubleshooting experiments that fail due to impure starting materials.
For researchers who want to examine the COAs backing the peptides in our catalog, visit our Certificates of Analysis page. Each document includes the full chromatogram and method details described in this guide.
[INTERNAL-LINK: “Certificates of Analysis” → /coas/]
[INTERNAL-LINK: “research peptide quality assurance” → /blog/research-peptide-quality-assurance-guide/]
For research use only. Not for human consumption.
Research Peptides with Full Analytical Documentation
Every Alpha Peptides compound ships with a Certificate of Analysis including HPLC purity data and mass spectrometry confirmation. For research use only, not for human consumption.
- BPC-157 — HPLC purity >98%, MS-confirmed molecular weight
- TB-500 — Full COA with analytical data on every batch
- SS-31 — Tetrapeptide, third-party tested for identity and purity
- KPV — Tripeptide with HPLC-verified purity documentation
View all Certificates of Analysis | Browse research peptides