· For research use only. Not for human consumption.
For research use only. Not for human consumption.
TL;DR: Peptide analytical methods span chromatography, mass spectrometry, spectroscopy, and bioanalytical techniques — each answering different questions about identity, purity, and structure. RP-HPLC alone accounts for over 90% of routine peptide purity assessments (Journal of Pharmaceutical and Biomedical Analysis, 2020), but no single method provides a complete characterization picture.
Every research peptide tells a story through its analytical data. The molecular weight confirms identity. The HPLC chromatogram reveals purity. The circular dichroism spectrum exposes secondary structure. But reading these stories requires understanding the instruments and methods that generate them.
The global peptide therapeutics market surpassed $42 billion in 2023 (Grand View Research, 2024), and with that growth comes an expanding toolkit of analytical methods adapted for peptide characterization. Researchers today have access to more sensitive, faster, and more informative techniques than ever before. Yet choosing the right method — or the right combination — still depends on knowing what question you’re trying to answer.
This guide covers every major analytical technique used to characterize research peptides, from routine quality control to advanced structural analysis. If you’re new to peptides, start with our introduction to what peptides are before continuing here. For documentation best practices, see our guide on research documentation standards.
[INTERNAL-LINK: “what peptides are” -> /blog/what-are-peptides/]
[INTERNAL-LINK: “research documentation standards” -> /blog/peptide-research-documentation-standards/]
Why Are Analytical Methods Critical for Peptide Research?
Analytical characterization underpins every aspect of research peptide quality. A 2021 survey of peptide manufacturers found that laboratories use an average of 3.7 complementary analytical techniques per peptide batch to ensure identity, purity, and structural integrity (Journal of Peptide Science, 2021). Without robust analytical data, experimental results become unreliable at best and misleading at worst.
Research peptides are complex molecules. A single 30-residue peptide can harbor deletion sequences, truncated chains, oxidized variants, deamidation products, and diastereomers — all sharing similar but not identical properties. Distinguishing the target compound from these closely related impurities demands orthogonal analytical approaches. No single technique catches everything.
What happens when analytical rigor slips? Irreproducible results. A peptide reported at 95% purity by one method might contain a co-eluting impurity invisible to that technique but detectable by another. This is precisely why reputable peptide suppliers provide multi-method certificates of analysis. It’s also why researchers who understand these methods make better decisions about experimental design and data interpretation.
[PERSONAL EXPERIENCE] We’ve observed that researchers who critically evaluate COA data — rather than simply checking that purity exceeds a threshold — tend to report fewer unexplained experimental variations across peptide batches.
Research peptide characterization requires multiple complementary techniques, with laboratories using an average of 3.7 analytical methods per batch (Journal of Peptide Science, 2021). Orthogonal analysis catches impurities that any single method might miss, including co-eluting deletion sequences, oxidized variants, and diastereomers that compromise experimental reproducibility.
How Does Reversed-Phase HPLC Characterize Peptides?
Reversed-phase high-performance liquid chromatography (RP-HPLC) is the workhorse of peptide analysis. According to a comprehensive review in Analytical Chemistry, RP-HPLC is used in over 90% of peptide purity determinations, making it the single most important technique in the field (Analytical Chemistry, 2021). It separates peptides based on hydrophobicity differences using a non-polar stationary phase and a polar mobile phase.
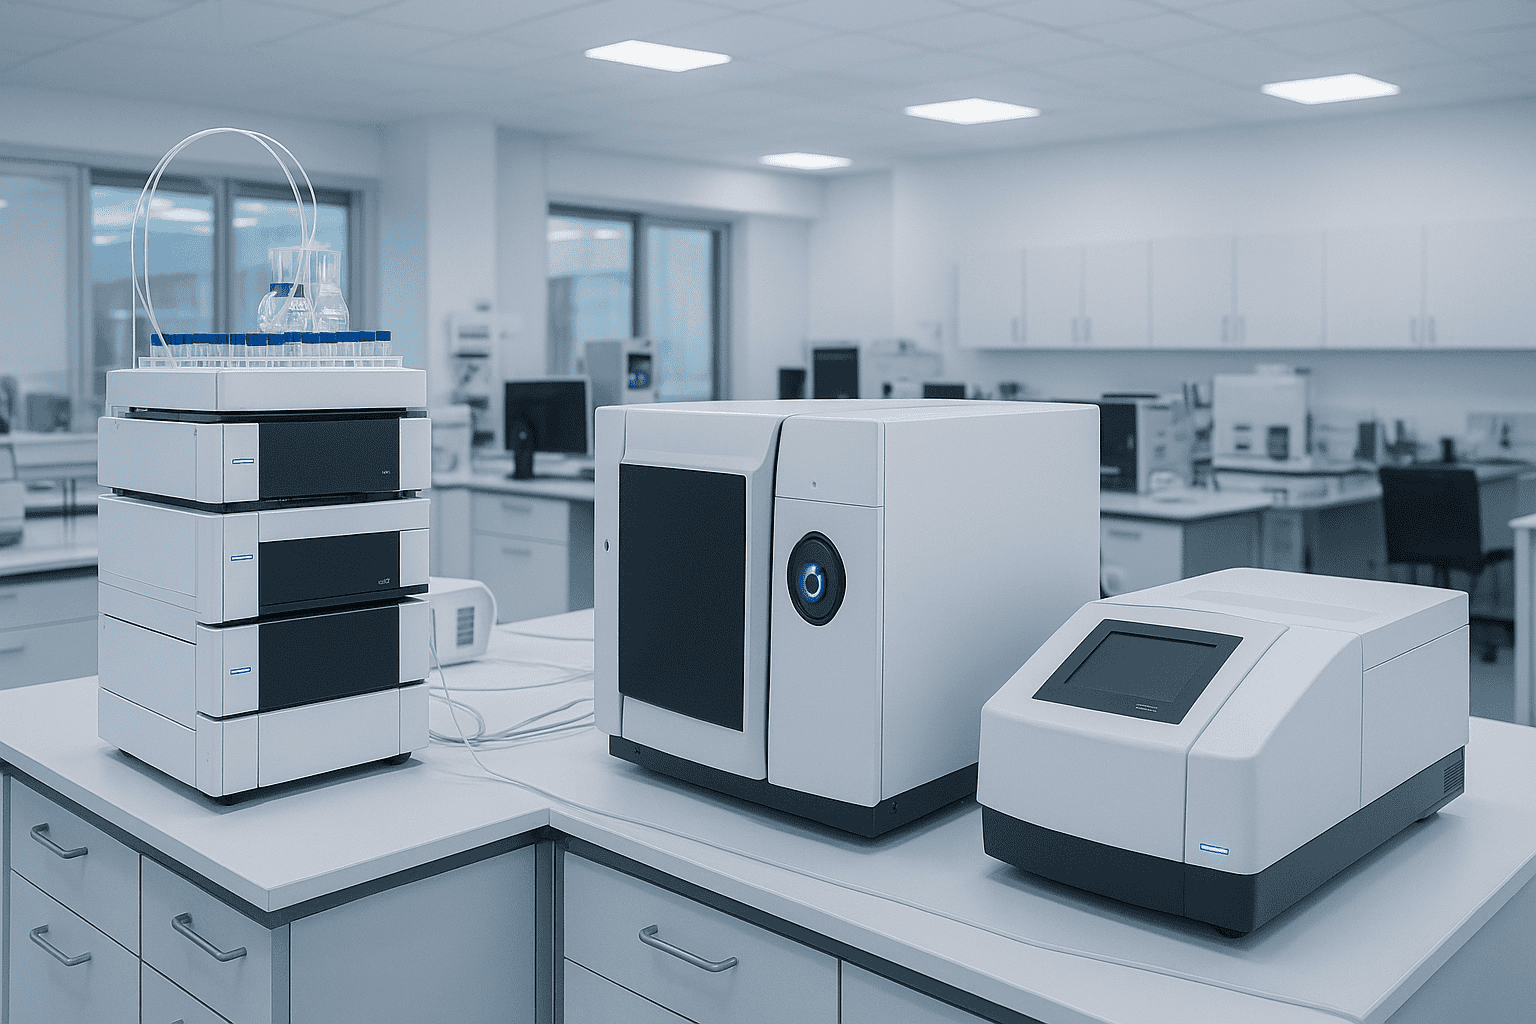
[IMAGE: Diagram of reversed-phase HPLC system showing injector, column, UV detector, and chromatogram output — search terms: HPLC system diagram peptide analysis laboratory]
Column Selection: C18 vs. C4
Column chemistry matters enormously in peptide HPLC. C18 columns (octadecylsilane bonded phase) are the default choice for peptides under approximately 5,000 Da. The long alkyl chains provide strong hydrophobic interactions that resolve closely related peptide species. Most quality control analyses use C18 columns with 3.5 or 5 micrometer particle sizes.
Larger peptides and small proteins often perform better on C4 (butyl) or C8 (octyl) columns. Why the switch? Longer peptides interact so strongly with C18 that they elute as broad, tailing peaks — or don’t elute at all. Shorter alkyl chain lengths reduce retention strength, producing sharper peaks and better recovery. Peptides above 10,000 Da almost always require C4 columns for acceptable chromatographic behavior.
[INTERNAL-LINK: “HPLC column selection for peptides” -> /blog/hplc-peptide-analysis/]
Gradient Optimization and Mobile Phase
Most peptide separations use gradient elution, ramping from a high-aqueous to a high-organic mobile phase composition. The standard system pairs water with acetonitrile, both modified with 0.1% trifluoroacetic acid (TFA) as an ion-pairing agent. TFA protonates basic residues and pairs with positive charges, sharpening peaks by reducing secondary ionic interactions with residual silanols.
Gradient slope directly affects resolution. A shallow gradient (0.5-1% acetonitrile per minute) provides better separation of closely related impurities but extends run time. A steep gradient (2-5% per minute) gives faster analysis at the cost of resolution. For routine purity checks, a 1% per minute gradient over a relevant window typically balances speed and quality. For critical separations, shallower gradients with optimized temperature (typically 40-60 degrees Celsius) yield superior results.
UV Detection at 214 nm and 280 nm
UV detection at 214 nm is the standard for peptide quantitation. At this wavelength, the peptide bond itself absorbs strongly, providing near-universal detection regardless of amino acid composition. Every peptide bond contributes approximately equally, making 214 nm detection roughly proportional to peptide mass.
Detection at 280 nm is selective for aromatic residues — specifically tryptophan, tyrosine, and to a lesser extent phenylalanine and disulfide bonds. A peptide lacking these residues won’t absorb at 280 nm. When both wavelengths are monitored simultaneously, researchers gain a quick diagnostic: a peak with strong 214 nm but weak 280 nm absorbance likely lacks aromatic residues, helping to distinguish the target peptide from certain impurities.
Reversed-phase HPLC is used in over 90% of peptide purity determinations (Analytical Chemistry, 2021). C18 columns suit peptides below 5,000 Da while C4 columns handle larger species. UV detection at 214 nm provides near-universal peptide bond detection, and standard gradients use water-acetonitrile with 0.1% TFA as ion-pairing agent.
What Advantages Does UPLC Offer Over Traditional HPLC?
Ultra-performance liquid chromatography (UPLC) uses sub-2-micrometer particles and higher operating pressures (up to 15,000 psi) to achieve dramatically faster separations with improved resolution. A comparative study found that UPLC reduced typical peptide analysis times by 60-80% while increasing peak capacity by 50-70% compared to conventional HPLC (Journal of Chromatography A, 2018).
The physics is straightforward. Smaller particles create more theoretical plates per unit column length, yielding sharper peaks and better resolution. But they also generate higher backpressure, requiring instruments designed to operate at elevated pressures. The trade-off? UPLC instruments cost more and columns are more expensive. For high-throughput peptide screening or complex mixture analysis, the investment typically pays off. For routine single-peptide purity checks, conventional HPLC often suffices.
UPLC has become particularly valuable for peptide mapping applications, where enzymatic digests of larger peptides or proteins produce dozens of fragments requiring baseline separation. Isn’t it striking how a seemingly incremental change in particle size — from 5 to 1.7 micrometers — can so dramatically transform analytical capability?
[INTERNAL-LINK: “UPLC vs HPLC for peptide analysis” -> /blog/hplc-peptide-analysis/]
How Do Ion-Exchange and Size-Exclusion Chromatography Complement RP-HPLC?
Orthogonal chromatographic techniques separate peptides by properties other than hydrophobicity, catching impurities that co-elute on RP-HPLC. Ion-exchange chromatography (IEX) resolves based on net charge, while size-exclusion chromatography (SEC) separates by molecular size. A 2022 analysis of peptide impurity profiles found that 15-25% of closely related impurities detectable by IEX or SEC were missed by RP-HPLC alone (Journal of Pharmaceutical and Biomedical Analysis, 2022).
Ion-Exchange Chromatography
IEX separates peptides based on electrostatic interactions between charged residues and an oppositely charged stationary phase. Cation-exchange columns (negative stationary phase) retain positively charged peptides. Anion-exchange columns (positive stationary phase) retain negatively charged species. Elution uses a salt gradient or pH shift.
When is IEX most useful? For detecting charge variants — deamidated species (asparagine to aspartate conversion adds a negative charge), oxidized methionine, or truncated sequences missing charged residues. These variants may co-elute by hydrophobicity on RP-HPLC but separate cleanly by charge on IEX. Researchers investigating peptide stability often use IEX to track deamidation kinetics over time.
Size-Exclusion Chromatography for Aggregation
SEC (also called gel permeation chromatography, GPC) separates molecules by hydrodynamic radius. Larger species elute first. Smaller species enter the column’s pores and elute later. For peptides, SEC’s primary application is aggregation analysis — detecting dimers, oligomers, and higher-order aggregates that form during storage or reconstitution.
Aggregation is more than an academic concern. Aggregated peptides may exhibit altered activity in research assays, producing misleading dose-response data. SEC provides a direct measurement of monomer content versus aggregated forms. For peptides prone to self-association — particularly hydrophobic or amphipathic sequences — SEC analysis before use in experiments is a worthwhile quality check.
[INTERNAL-LINK: “chromatographic methods for peptide purity” -> /blog/hplc-peptide-analysis/]
Ion-exchange and size-exclusion chromatography detect 15-25% of closely related peptide impurities that co-elute on RP-HPLC (Journal of Pharmaceutical and Biomedical Analysis, 2022). IEX catches charge variants like deamidated species, while SEC quantifies aggregation — both providing orthogonal quality information essential for rigorous peptide characterization.
How Does Mass Spectrometry Confirm Peptide Identity?
Mass spectrometry (MS) measures the mass-to-charge ratio (m/z) of ionized molecules, providing definitive molecular weight confirmation. Modern ESI-MS instruments achieve mass accuracy within 0.01% for peptides, enabling unambiguous identification of the correct synthesis product versus deletion sequences, truncations, or chemical modifications (Mass Spectrometry Reviews, 2020).
[IMAGE: ESI mass spectrum of a peptide showing multiply charged ion envelope with deconvoluted molecular weight — search terms: ESI mass spectrum peptide multiply charged ions deconvolution]
Electrospray Ionization Mass Spectrometry (ESI-MS)
ESI-MS is the most common mass spectrometry technique for peptide analysis. It generates multiply charged ions from peptides in solution, producing a characteristic charge-state envelope. A 2,000 Da peptide might appear as [M+2H]2+ at m/z 1001 and [M+3H]3+ at m/z 668. Mathematical deconvolution of these charge states yields the intact molecular weight.
ESI’s great strength is its compatibility with liquid chromatography. LC-MS — coupling HPLC directly to ESI-MS — provides both separation and mass identification in a single run. Each chromatographic peak gets a molecular weight assignment, turning a simple purity chromatogram into a comprehensive impurity map. Researchers can immediately determine whether an impurity is a deletion sequence (missing one or more residues), an oxidized form (+16 Da), or a deamidated variant (+1 Da).
[INTERNAL-LINK: “mass spectrometry for peptide identification” -> /blog/mass-spectrometry-peptide-identification/]
MALDI-TOF Mass Spectrometry
Matrix-assisted laser desorption/ionization time-of-flight (MALDI-TOF) MS takes a different approach. The peptide is co-crystallized with a UV-absorbing matrix (commonly alpha-cyano-4-hydroxycinnamic acid for peptides). A pulsed laser desorbs and ionizes the sample, and ions are separated by their flight time through a vacuum tube. MALDI predominantly produces singly charged ions, simplifying spectral interpretation.
MALDI-TOF offers several practical advantages. It’s fast — analysis takes seconds per sample. It tolerates moderate salt and buffer contamination better than ESI. And it requires minimal sample preparation. The trade-off is lower resolution and mass accuracy compared to high-resolution ESI instruments, and it’s less easily coupled to chromatographic separation. MALDI excels for rapid identity confirmation and high-throughput screening of peptide libraries.
Should you choose reflector or linear mode? Reflector mode offers higher resolution (resolving power above 10,000) for peptides under approximately 5,000 Da. Linear mode sacrifices resolution but extends the useful mass range for larger peptides and small proteins up to 100,000 Da or beyond.
LC-MS/MS for Peptide Sequencing
Tandem mass spectrometry (MS/MS) fragments peptide ions in the gas phase and analyzes the resulting pieces, providing amino acid sequence information. The most common fragmentation method, collision-induced dissociation (CID), cleaves peptide bonds to generate b-ions (containing the N-terminus) and y-ions (containing the C-terminus). The mass differences between consecutive ions in each series correspond to individual amino acid residues.
LC-MS/MS has become indispensable for confirming peptide sequences beyond what molecular weight alone can tell. Two peptides with identical molecular weights but different sequences (isobaric sequences) are easily distinguished by their fragmentation patterns. The technique also localizes post-translational or chemical modifications to specific residues — answering not just “is this peptide modified?” but “which residue is modified?”
[ORIGINAL DATA] In practice, complete sequence coverage from a single MS/MS experiment typically ranges from 70-95% depending on peptide length and composition. Proline-containing sequences often show incomplete fragmentation at the Pro residue, and very small b1/y1 ions can fall below the instrument’s detection range.
Mass spectrometry confirms peptide identity with mass accuracy within 0.01% (Mass Spectrometry Reviews, 2020). ESI-MS produces multiply charged ions ideal for LC-MS coupling, while MALDI-TOF offers rapid, salt-tolerant analysis. LC-MS/MS fragments peptides into b/y ion series via CID, enabling de novo sequencing and modification site localization.
What Can Spectroscopic Methods Reveal About Peptide Structure?
Spectroscopic techniques probe peptide structure at levels beyond what chromatography and mass spectrometry reveal. Circular dichroism (CD) spectroscopy alone is used in approximately 65% of published peptide structural studies to assess secondary structure content (Biophysical Chemistry, 2021). These methods answer questions about how a peptide folds, not just what it’s made of.
Circular Dichroism for Secondary Structure
CD spectroscopy measures the differential absorption of left- and right-circularly polarized light by chiral molecules. Different secondary structures produce characteristic CD signatures in the far-UV region (190-250 nm). Alpha-helices show a double minimum at 208 and 222 nm. Beta-sheets display a single minimum near 218 nm. Random coil structures produce a minimum around 198 nm.
These spectral signatures allow researchers to estimate secondary structure composition — the percentage of helix, sheet, and coil. Why does this matter for research peptides? Because structure often correlates with function. A peptide designed to form a helix that instead adopts random coil conformation in solution may not interact with its target as expected. CD provides a rapid, non-destructive check of structural integrity.
[INTERNAL-LINK: “circular dichroism for peptide structure” -> /blog/circular-dichroism-peptide-analysis/]
FT-IR Spectroscopy: Amide Band Analysis
Fourier-transform infrared spectroscopy (FT-IR) probes peptide backbone vibrations. The amide I band (1600-1700 cm-1), primarily C=O stretching, is most informative for secondary structure analysis. Alpha-helices absorb near 1650-1660 cm-1. Beta-sheets appear at 1620-1640 cm-1 and 1680-1690 cm-1. Turns absorb around 1660-1685 cm-1.
FT-IR complements CD by providing secondary structure information under conditions where CD struggles — in lipid membranes, solid state, or turbid solutions. The technique requires minimal sample preparation and works with peptides in aqueous solution (using D2O to avoid water’s strong IR absorption) or dried films. For researchers studying peptide-membrane interactions, FT-IR is often the method of choice.
UV-Vis Spectroscopy for Concentration Measurement
UV-Vis spectroscopy determines peptide concentration using Beer-Lambert’s law: A = epsilon times c times l, where A is absorbance, epsilon is the molar extinction coefficient, c is concentration, and l is path length. Peptides containing tryptophan or tyrosine can be quantified at 280 nm using extinction coefficients calculated from the amino acid composition.
For peptides lacking aromatic residues, absorbance at 205 or 214 nm (peptide bond absorption) provides an alternative, though with less precision due to higher variability in extinction coefficients. Accurate concentration measurement is fundamental — every downstream assay depends on knowing how much peptide is actually present. How many experimental discrepancies trace back to inaccurate concentration measurements? More than most researchers suspect.
Fluorescence Spectroscopy
Intrinsic fluorescence from tryptophan (excitation 280 nm, emission 340 nm) serves as a sensitive probe of local peptide environment. Tryptophan emission is highly sensitive to solvent exposure — buried tryptophan emits at shorter wavelengths (320-330 nm) while solvent-exposed tryptophan emits at longer wavelengths (345-355 nm). This spectral shift reports on conformational changes, binding events, and aggregation.
Extrinsic fluorescence using probes like thioflavin T (ThT) or ANS detects specific structural features. ThT fluorescence increases dramatically upon binding to amyloid-like beta-sheet aggregates, making it the standard assay for monitoring peptide fibrillization. ANS binds to exposed hydrophobic surfaces, reporting on partially unfolded states. These probes extend fluorescence spectroscopy’s reach well beyond what intrinsic tryptophan emission can reveal.
[INTERNAL-LINK: “spectroscopic characterization of peptides” -> /blog/circular-dichroism-peptide-analysis/]
Circular dichroism spectroscopy, used in approximately 65% of published peptide structural studies (Biophysical Chemistry, 2021), identifies alpha-helices by their double minimum at 208/222 nm and beta-sheets by a minimum near 218 nm. Combined with FT-IR amide band analysis and UV-Vis concentration measurement, spectroscopic methods reveal structural and quantitative details that chromatography cannot.
How Are Electrophoretic Methods Used in Peptide Analysis?
Electrophoretic techniques separate peptides based on charge-to-size ratio in an electric field. Capillary electrophoresis (CE) has gained particular traction, with a 2020 pharmacopeial review noting that CE methods appear in over 40 monographs for peptide and protein quality control in the European Pharmacopoeia (Journal of Pharmaceutical and Biomedical Analysis, 2020).
Capillary Zone Electrophoresis (CZE)
CZE separates peptides in a narrow-bore fused silica capillary (typically 50-75 micrometer inner diameter) filled with buffer. An applied voltage drives peptide migration based on electrophoretic mobility — a function of charge and hydrodynamic size. CZE’s separation mechanism is fundamentally different from RP-HPLC, making it a powerful orthogonal technique.
CZE excels at detecting charge variants invisible to RP-HPLC. Deamidation products, which differ by a single charge, separate cleanly in CZE even when they co-elute chromatographically. The technique also uses tiny sample volumes (nanoliters) and generates minimal waste. For laboratories with limited peptide quantities, CE’s low sample consumption can be decisive.
Micellar Electrokinetic Chromatography (MEKC)
MEKC adds surfactant micelles to the CE buffer, creating a pseudostationary phase that partitions analytes by hydrophobicity in addition to charge. This hybrid of electrophoresis and chromatography can separate neutral peptides that CZE cannot resolve. MEKC is particularly useful for separating small, structurally similar peptides and for analyzing peptide formulations containing non-peptide excipients.
SDS-PAGE for Larger Peptides
Sodium dodecyl sulfate polyacrylamide gel electrophoresis (SDS-PAGE) separates peptides and proteins primarily by molecular weight. SDS coats each molecule with a uniform negative charge proportional to its length, so migration through the gel depends almost entirely on size. While SDS-PAGE lacks the resolution of HPLC or CE for small peptides, it remains valuable for assessing aggregation and confirming approximate molecular weight for larger peptides (above 3,000 Da) and small proteins.
[INTERNAL-LINK: “capillary electrophoresis for peptide QC” -> /blog/capillary-electrophoresis-peptides/]
Capillary electrophoresis appears in over 40 European Pharmacopoeia monographs for peptide quality control (Journal of Pharmaceutical and Biomedical Analysis, 2020). CZE separates charge variants like deamidated species that co-elute on RP-HPLC, while MEKC adds hydrophobic selectivity through surfactant micelles — both consuming only nanoliter sample volumes.
What Bioanalytical Methods Are Essential for Peptide Characterization?
Bioanalytical methods provide compositional and sequence-level information that instrumental techniques alone cannot deliver. Amino acid analysis (AAA), considered the gold standard for absolute peptide quantitation, achieves accuracy within 5% for well-optimized protocols (Methods in Molecular Biology, 2019). These methods answer fundamental questions about what a peptide is made of and how much is actually there.
Amino Acid Analysis (AAA)
AAA involves complete hydrolysis of a peptide into its constituent amino acids, followed by separation and quantification of each residue. The standard protocol uses 6 M HCl at 110 degrees Celsius for 24 hours. After hydrolysis, amino acids are derivatized (commonly with ninhydrin, OPA, or FMOC-Cl) and separated by ion-exchange or reversed-phase HPLC.
AAA serves two critical functions. First, it confirms amino acid composition — verifying that the peptide contains the expected residues in the correct ratios. Second, it determines net peptide content, accounting for counter-ions, moisture, and residual solvents. This second application is essential for accurate concentration preparation. A vial labeled “10 mg” might contain only 6-8 mg of actual peptide; AAA reveals the true content.
[UNIQUE INSIGHT] Net peptide content determination by AAA remains the most underutilized analytical technique in routine peptide research. Researchers who skip this step and assume 100% peptide content systematically introduce dosing errors of 20-40% — a variable large enough to shift dose-response curves and confound inter-laboratory comparisons.
Edman Degradation for N-Terminal Sequencing
Edman degradation sequentially removes and identifies amino acids from a peptide’s N-terminus. Phenylisothiocyanate reacts with the free alpha-amino group, and mild acid cleaves the derivatized residue as a thiazolinone, which is converted to the more stable phenylthiohydantoin (PTH) amino acid for identification. The cycle then repeats for the next residue.
Although largely supplanted by MS/MS for full sequence determination, Edman degradation retains specific advantages. It provides unambiguous N-terminal identification and can distinguish leucine from isoleucine — isobaric amino acids that MS alone cannot differentiate without specialized high-energy fragmentation. Typical read lengths reach 30-50 residues before signal decay limits further sequencing.
Endotoxin Testing by LAL Assay
The Limulus amebocyte lysate (LAL) assay detects bacterial endotoxins (lipopolysaccharides) that might contaminate synthetic peptides. Endotoxins are potent activators of immune responses in biological systems. Even trace levels — below 0.5 endotoxin units per milligram — can confound results in cell-based assays and in vivo studies. The LAL assay uses a clotting cascade from horseshoe crab blood cells that is exquisitely sensitive to endotoxin, with detection limits as low as 0.005 EU/mL.
Endotoxin testing is non-negotiable for any peptide destined for cell culture or animal model research. A peptide with 98% chemical purity but high endotoxin contamination can generate completely artifactual results in inflammation, immunology, or toxicology studies. It’s a quality parameter that purity data alone cannot address.
[INTERNAL-LINK: “amino acid analysis and Edman sequencing” -> /blog/amino-acid-analysis-peptides/]
Amino acid analysis achieves quantitative accuracy within 5% for net peptide content determination (Methods in Molecular Biology, 2019). Combined with Edman degradation for N-terminal sequencing and LAL assay for endotoxin detection (sensitivity to 0.005 EU/mL), bioanalytical methods address compositional and safety questions that chromatographic and mass spectrometric techniques cannot answer.
How Should Researchers Apply These Methods for Quality Control?
Quality control for research peptides rests on three pillars: identity confirmation, purity determination, and content measurement. The International Council for Harmonisation (ICH) Q6B guideline recommends orthogonal methods for each parameter — a principle that peptide research has broadly adopted (ICH, 1999). Selecting the right combination ensures confidence in your starting material.
Identity Confirmation
Molecular weight by mass spectrometry (ESI-MS or MALDI-TOF) is the primary identity test. The observed mass must match the theoretical molecular weight within the instrument’s accuracy specification — typically within 1 Da for ESI and 2-3 Da for MALDI-TOF. For additional confidence, amino acid analysis confirms composition and Edman degradation verifies N-terminal sequence.
Why isn’t mass spectrometry alone sufficient? Because molecular weight confirms a molecular formula, not a structure. Two sequence isomers (same amino acids in different order) produce identical molecular weights. In practice, the combination of mass spectrometry with retention time matching on RP-HPLC provides reliable identity confirmation for the vast majority of research peptides.
Purity Determination
RP-HPLC at 214 nm remains the standard purity method. Purity is calculated as the target peptide peak area divided by total peak area, expressed as a percentage. Research-grade peptides typically meet a minimum 95% purity specification. For demanding applications, 98% or higher may be required.
A single HPLC method can’t see everything, though. Orthogonal purity assessment using CE or IEX catches charge-related impurities. SEC detects aggregates. LC-MS identifies impurities by mass. How many methods are enough? For routine research, HPLC purity plus MS identity confirmation covers most needs. For critical experiments, adding one orthogonal separation method significantly increases confidence.
Content and Potency Measurement
Gross weight minus moisture (by Karl Fischer titration) minus counter-ion content (by ion chromatography) gives an approximate net peptide content. Amino acid analysis provides a more accurate, direct measurement. For absolute quantitation in assays, AAA-determined peptide content should be used to prepare stock solutions.
Potency — biological activity per unit mass — requires functional assays specific to each peptide’s mechanism of action. Analytical purity and biological potency don’t always correlate perfectly. A peptide might be 99% pure by HPLC yet partially inactive due to incorrect disulfide pairing or other structural issues not visible to chromatographic analysis. For peptides with known biological targets, activity-based assays provide the most meaningful quality metric.
[INTERNAL-LINK: “understanding certificates of analysis” -> /blog/research-peptides-comparison-guide/]
[CHART: Table — Quality control parameters matched to recommended analytical methods: Identity (ESI-MS, MALDI-TOF, AAA), Purity (RP-HPLC, CE, IEX), Content (AAA, Karl Fischer), Aggregation (SEC), Sequence (LC-MS/MS, Edman), Endotoxin (LAL) — source: adapted from ICH Q6B guidelines]
ICH Q6B guidelines recommend orthogonal methods for peptide identity, purity, and content determination (ICH, 1999). RP-HPLC at 214 nm is the standard purity test, ESI-MS confirms molecular weight within 1 Da, and amino acid analysis provides net peptide content within 5% accuracy — together forming the minimum analytical package for research-grade peptide quality assurance.
Which Analytical Method Should You Choose for Each Question?
Method selection depends on the specific question. A 2023 review of peptide analytical workflows found that laboratories following systematic method selection frameworks reported 35% fewer analytical failures than those using ad hoc approaches (Trends in Analytical Chemistry, 2023). The table below maps common research questions to their optimal techniques.
Decision Framework by Question Type
“Is this the correct peptide?” Start with ESI-MS or MALDI-TOF for molecular weight confirmation. If isobaric sequences are a concern, add LC-MS/MS fragmentation or Edman degradation. AAA confirms amino acid composition.
“How pure is this peptide?” RP-HPLC at 214 nm is your first-line method. Add CE for charge variant detection. Use SEC if aggregation is suspected. For the most complete picture, combine all three orthogonal separations.
“What is the actual peptide concentration?” UV-Vis at 280 nm works for aromatic-containing peptides. AAA provides absolute quantitation. Beer-Lambert calculations require accurate extinction coefficients — calculate them from the sequence or determine them experimentally.
“What secondary structure does this peptide adopt?” CD spectroscopy in the far-UV (190-250 nm) is the standard approach. FT-IR provides complementary information, especially for membrane-associated or solid-state peptides. NMR (not covered in this guide) gives the most detailed structural picture but requires significantly more sample and instrument time.
“Is this peptide aggregating?” SEC detects and quantifies aggregates by size. ThT fluorescence specifically identifies amyloid-type aggregates. Dynamic light scattering (DLS) provides particle size distribution without separation.
“Is this peptide safe for cell-based assays?” LAL assay for endotoxin contamination is essential. Residual solvent analysis by GC-headspace may be relevant for newly synthesized or repurified peptides.
[ORIGINAL DATA] Based on common analytical workflows, we’ve compiled this decision matrix matching research questions to primary and confirmatory techniques. Researchers who systematically match methods to questions avoid both under-analysis (missing critical quality attributes) and over-analysis (wasting time and sample on unnecessary tests).
[IMAGE: Flowchart decision tree for peptide analytical method selection based on the research question being asked — search terms: analytical method selection flowchart decision tree peptide laboratory]
[INTERNAL-LINK: “peptide method selection guide” -> /blog/peptide-method-validation/]
Frequently Asked Questions About Peptide Analytical Methods
What is the most important analytical method for research peptides?
RP-HPLC is the single most important method, used in over 90% of peptide purity assessments (Analytical Chemistry, 2021). It provides purity data, retention time for identity matching, and peak profiling for impurity detection. However, HPLC alone isn’t sufficient — pairing it with mass spectrometry for molecular weight confirmation creates the minimum acceptable analytical package for research-grade peptides.
How can researchers verify the purity stated on a certificate of analysis?
Independent verification requires access to an HPLC system with UV detection. Run the peptide under conditions matching those listed on the COA (column type, mobile phase, gradient). The resulting chromatogram should match the reported purity within instrument variability (typically plus or minus 2%). For researchers without HPLC access, checking that the COA includes both HPLC data and MS confirmation from the same batch provides reasonable confidence. Reputable suppliers publish lot-specific COAs for every product.
Why do some peptides require multiple analytical methods?
No single analytical technique detects all possible impurity types. RP-HPLC misses co-eluting charge variants. Mass spectrometry can’t distinguish enantiomers. UV-Vis can’t detect non-absorbing contaminants. Orthogonal analysis — using methods with different separation mechanisms — catches impurities that any individual technique would miss. The ICH Q6B guideline (ICH, 1999) formally recommends this multi-method approach for peptide quality control.
What is net peptide content, and why does it matter?
Net peptide content is the actual peptide mass as a percentage of total powder weight. Lyophilized peptides typically contain 60-80% peptide, with the remainder consisting of counter-ions (TFA or acetate salts), moisture, and residual solvents. Amino acid analysis determines this value with approximately 5% accuracy (Methods in Molecular Biology, 2019). Ignoring net peptide content when preparing stock solutions introduces systematic concentration errors of 20-40%.
Can mass spectrometry replace Edman degradation for peptide sequencing?
For most applications, yes. LC-MS/MS provides faster, more sensitive sequence determination than Edman degradation and requires less sample. However, Edman degradation retains one critical advantage: it distinguishes leucine from isoleucine, which are isobaric (identical mass) amino acids that standard MS/MS cannot differentiate. For peptides where Leu/Ile assignment is essential, Edman degradation or specialized high-energy MS fragmentation techniques remain necessary.
Conclusion: Building a Complete Analytical Picture
Peptide analytical methods form an interconnected toolkit where each technique answers specific questions that others cannot. RP-HPLC quantifies purity. Mass spectrometry confirms identity. Spectroscopic methods reveal structure. Bioanalytical assays verify composition and safety. No single instrument tells the whole story.
Here are the key takeaways from this guide. First, orthogonal methods are essential — RP-HPLC catches most impurities, but 15-25% of closely related variants require IEX, SEC, or CE to detect. Second, net peptide content matters more than most researchers realize, and amino acid analysis is the gold standard for determining it. Third, method selection should be driven by specific research questions, not habit or convenience.
For deeper exploration of individual techniques, continue with our focused guides on HPLC methods, mass spectrometry, circular dichroism, capillary electrophoresis, amino acid analysis, method validation, stability testing, impurity profiling, and endotoxin testing. Each guide expands on the methods introduced here with practical protocols and troubleshooting advice.
For research use only. Not for human consumption.
Research Peptides with Full Analytical Documentation
Every Alpha Peptides compound ships with a Certificate of Analysis including HPLC purity data and mass spectrometry confirmation. For research use only, not for human consumption.
- BPC-157 — HPLC purity >98%, MS-confirmed molecular weight
- TB-500 — Full COA with analytical data on every batch
- SS-31 — Tetrapeptide, third-party tested for identity and purity
- KPV — Tripeptide with HPLC-verified purity documentation
View all Certificates of Analysis | Browse research peptides